

Skip to content
AQIRadar
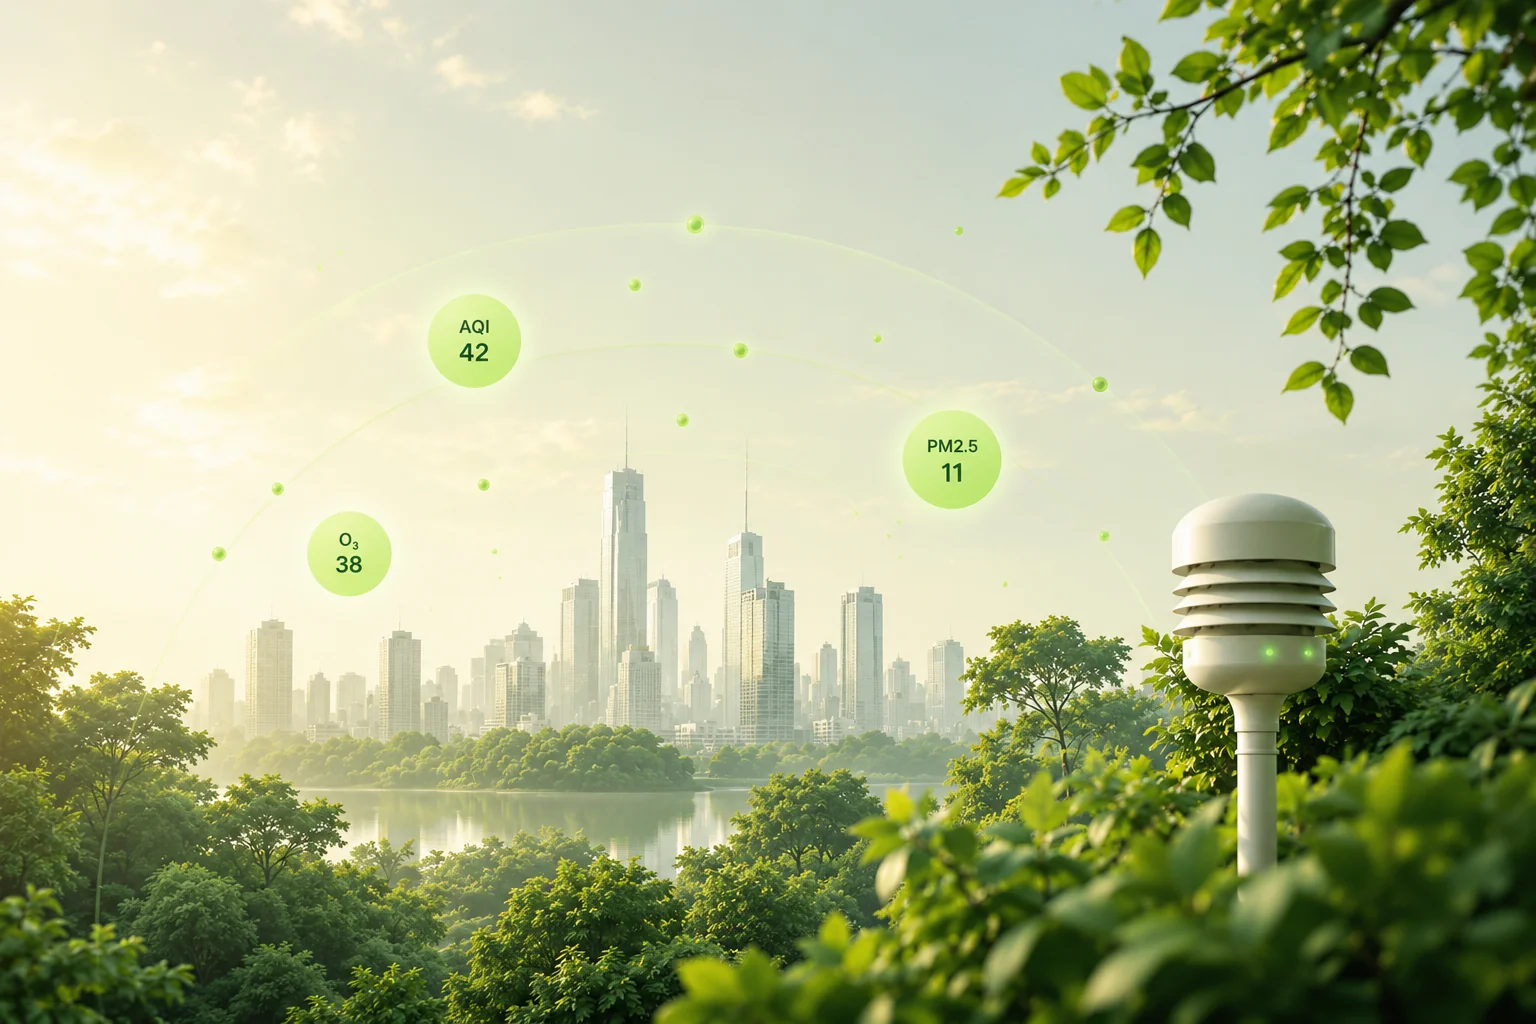
A green city skyline under clean air at golden hour
Real-time air quality, worldwide

Know the air you breathe, the moment it changes.

AQIRadar turns thousands of monitoring stations into one clear number, a colour, and a plan — live AQI, forecasts and health guidance for any city on earth.

Explore the live map
10,000+stations reporting now

10K+

Monitoring stations

140+

Countries covered

8-day

Pollutant forecast

120K+

People breathing easier

Trusted data from the networks that matter

CPCBWAQIOpenAQUS EPAOpen-MeteoNASA
Live map

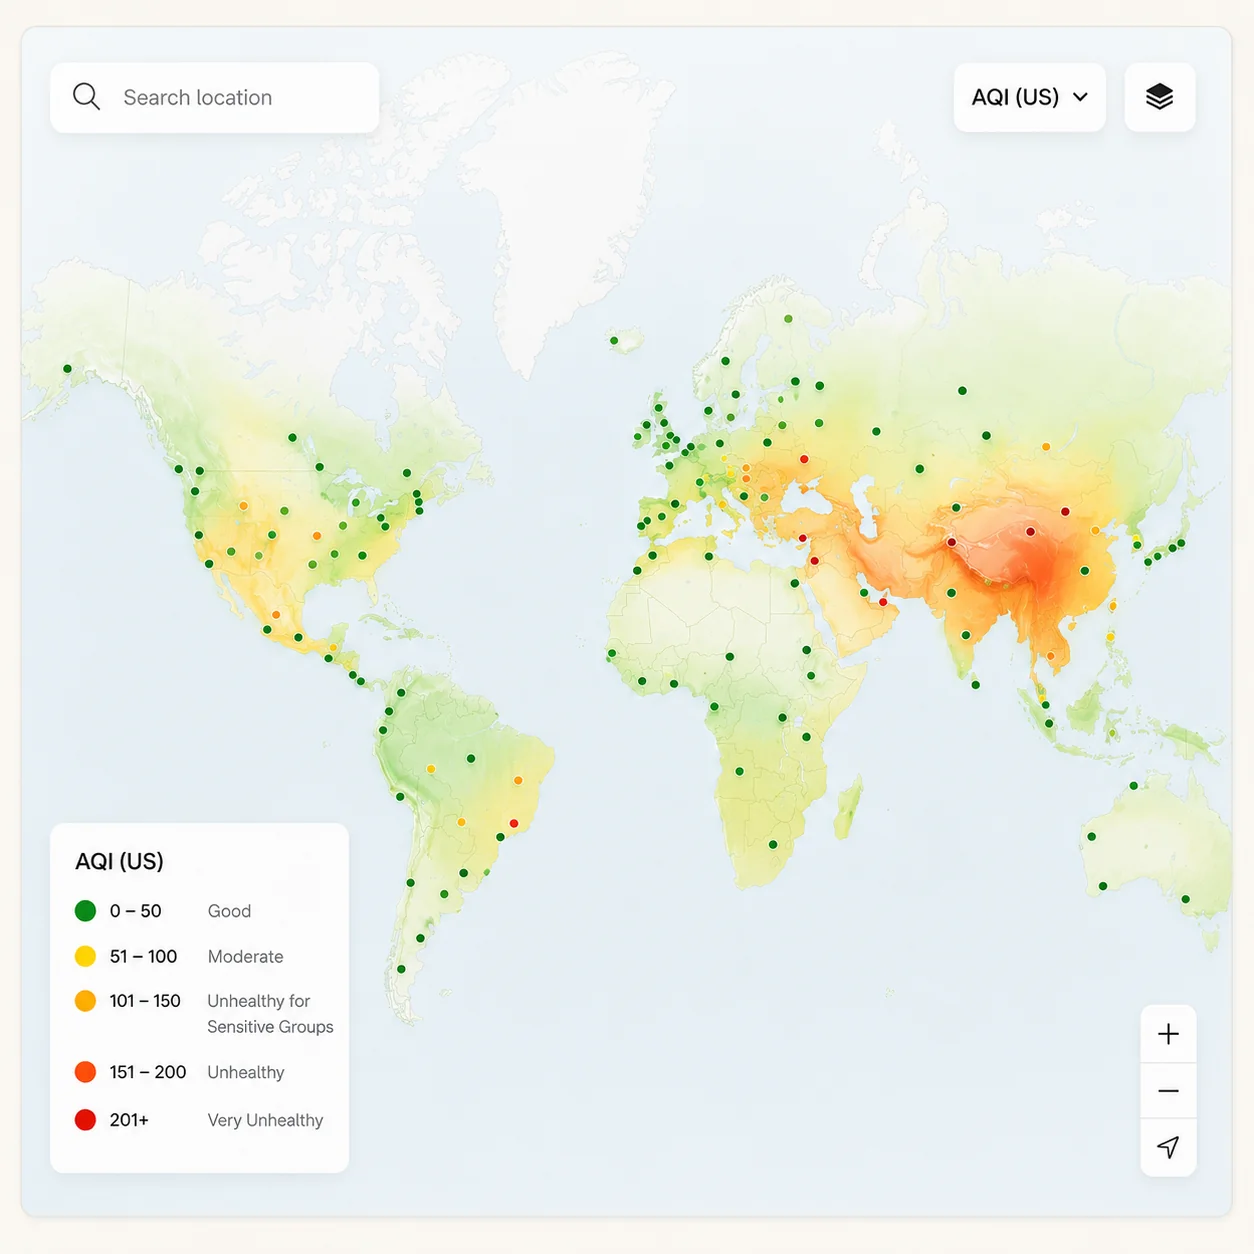
Every station, on one live map.

Pan the globe and watch readings update in real time — pollutant layers, heat overlays, and station-level detail wherever you look.

  • Real-time readings from 10,000+ stations
  • Toggle PM2.5, PM10, O₃, NO₂ and more
  • AQI colour-coded heat overlays
World air-quality map with live station readings
140+countries mapped
Your cities

Track the cities you care about.

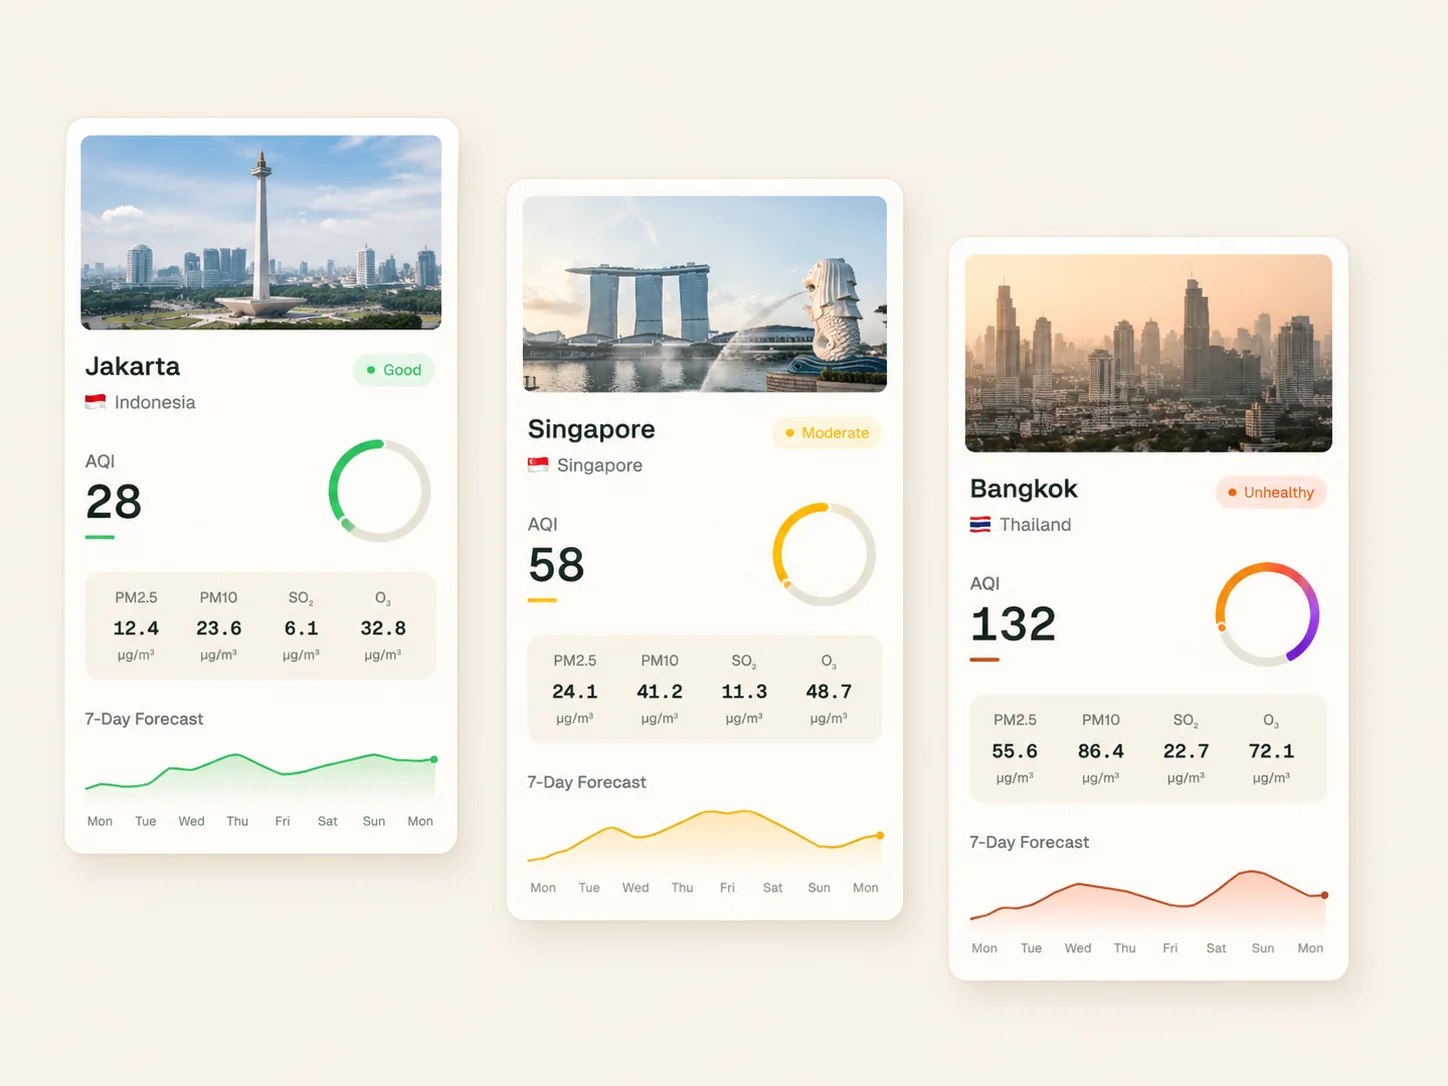
Build a watchlist of the places that matter — home, family, the office — each with its own gauge, pollutant breakdown and forecast.

  • One glance for every city you follow
  • Dominant pollutant and sub-indices
  • 8-day forecast on every card
City air-quality cards with gauges, pollutant breakdowns and forecasts
Hourlydata refresh
How it works

Air quality you can measure, guidance you can act on.

Official networks in, one consistent index out — with the health advice that goes with it.

We collect

Readings stream in from CPCB, WAQI, OpenAQ and the US EPA — thousands of reference-grade stations, every hour.

We normalise

Every pollutant is converted to one comparable index, so a number in Delhi means the same as a number in Berlin.

We advise

You get the colour, the dominant pollutant, an 8-day outlook and plain-language advice for the day ahead.

A global network of air-quality monitoring stations lighting up the planet
Total coverage

Stop guessing. Know the air, 100% of the time.

From a single street corner to the whole planet — every station, every pollutant, refreshed hour by hour.

PM2.5

11.6

Good

AQI

42

Good

O₃

38

Good

NO₂

16

Good

News & Blog

The air, explained.

Explore all posts
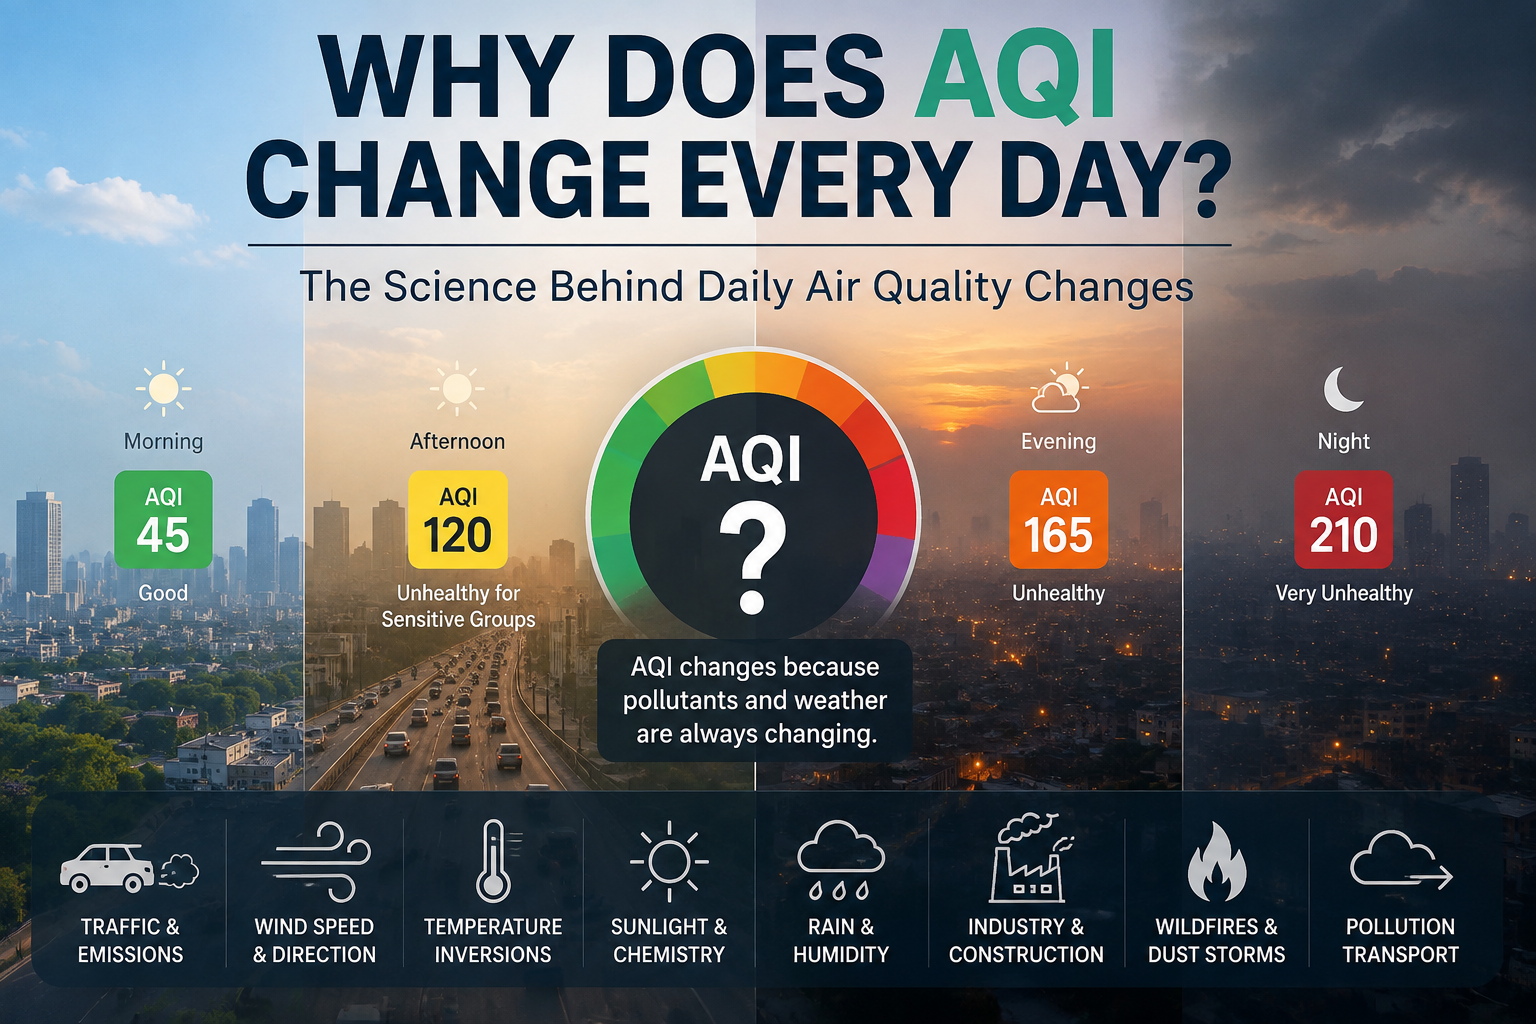
Why Does AQI Change Every Day? Understanding the Science Behind Daily Air Quality Changes
aqichange

Why Does AQI Change Every Day? Understanding the Science Behind Daily Air Quality Changes

AQI can change dramatically from one day to the next—and sometimes within just a few hours. Weather, traffic, wind, temperature inversions, sunlight, rain, wildfires, dust, and atmospheric chemistry all influence how pollutants build up, disperse, or transform. In this guide, discover the science behind daily AQI changes, which pollutants drive them, and how to understand what today’s AQI really means for you.

Faheem M

“AQIRadar is the first thing I check every morning. One look and I know whether the kids can play outside.”

A

Aanya Mehra

Parent · New Delhi

Questions

Frequently asked questions

The short answers on where our readings come from, how often they move, and what the numbers actually mean for your day.

  • We aggregate readings from official government and reference-grade networks — CPCB, WAQI, OpenAQ, the US EPA — and pair them with Open-Meteo forecasts, all normalised onto one clear AQI scale.

  • Live readings refresh hourly from the monitoring networks, and forecasts extend up to eight days ahead so you can plan your week around the air.

  • AQIRadar shows a clear six-band scale — Good, Moderate, Unhealthy for Sensitive, Unhealthy, Very Unhealthy and Hazardous — each with a colour and plain-language health guidance.

  • Yes — checking live air quality, tracking your cities, and reading forecasts is free to start. No account required to explore the map.

  • Build a watchlist of every place that matters — home, family, the office — each with its own gauge, pollutant breakdown and forecast.

Start today

Ready to breathe with confidence?

Real-time air quality insights. Healthier choices. A better tomorrow — free, and no account needed.