
5 October 2026 · Faheem M
Noida AQI: Current Air Quality, Forecast & Health Guide
Noida had the second-worst winter air in India last season, averaging 166 µg/m³ of PM2.5. Here's how to read Noida AQI, where the pollution comes from, which sectors are hotspots, what October to January looks like, and simple ways to protect your family.

Noida AQI was 111 on the US scale at the time of writing on 5 October 2026 — "Unhealthy for Sensitive Groups". That is a typical early-October number, but it is the calm before Noida's worst months: from late October to January, India's official CPCB index regularly climbs past 300 ("Very poor") and sometimes near 400 (Noida hit 396 on 24 November 2025).
For the reading right now, check AQIRadar's live Noida AQI page, which refreshes hourly, or open the live air quality map to compare your sector with Delhi, Ghaziabad and Greater Noida. This guide explains what the number means, where Noida pollution comes from, when it gets worse, and what you can do about it.
Noida AQI right now
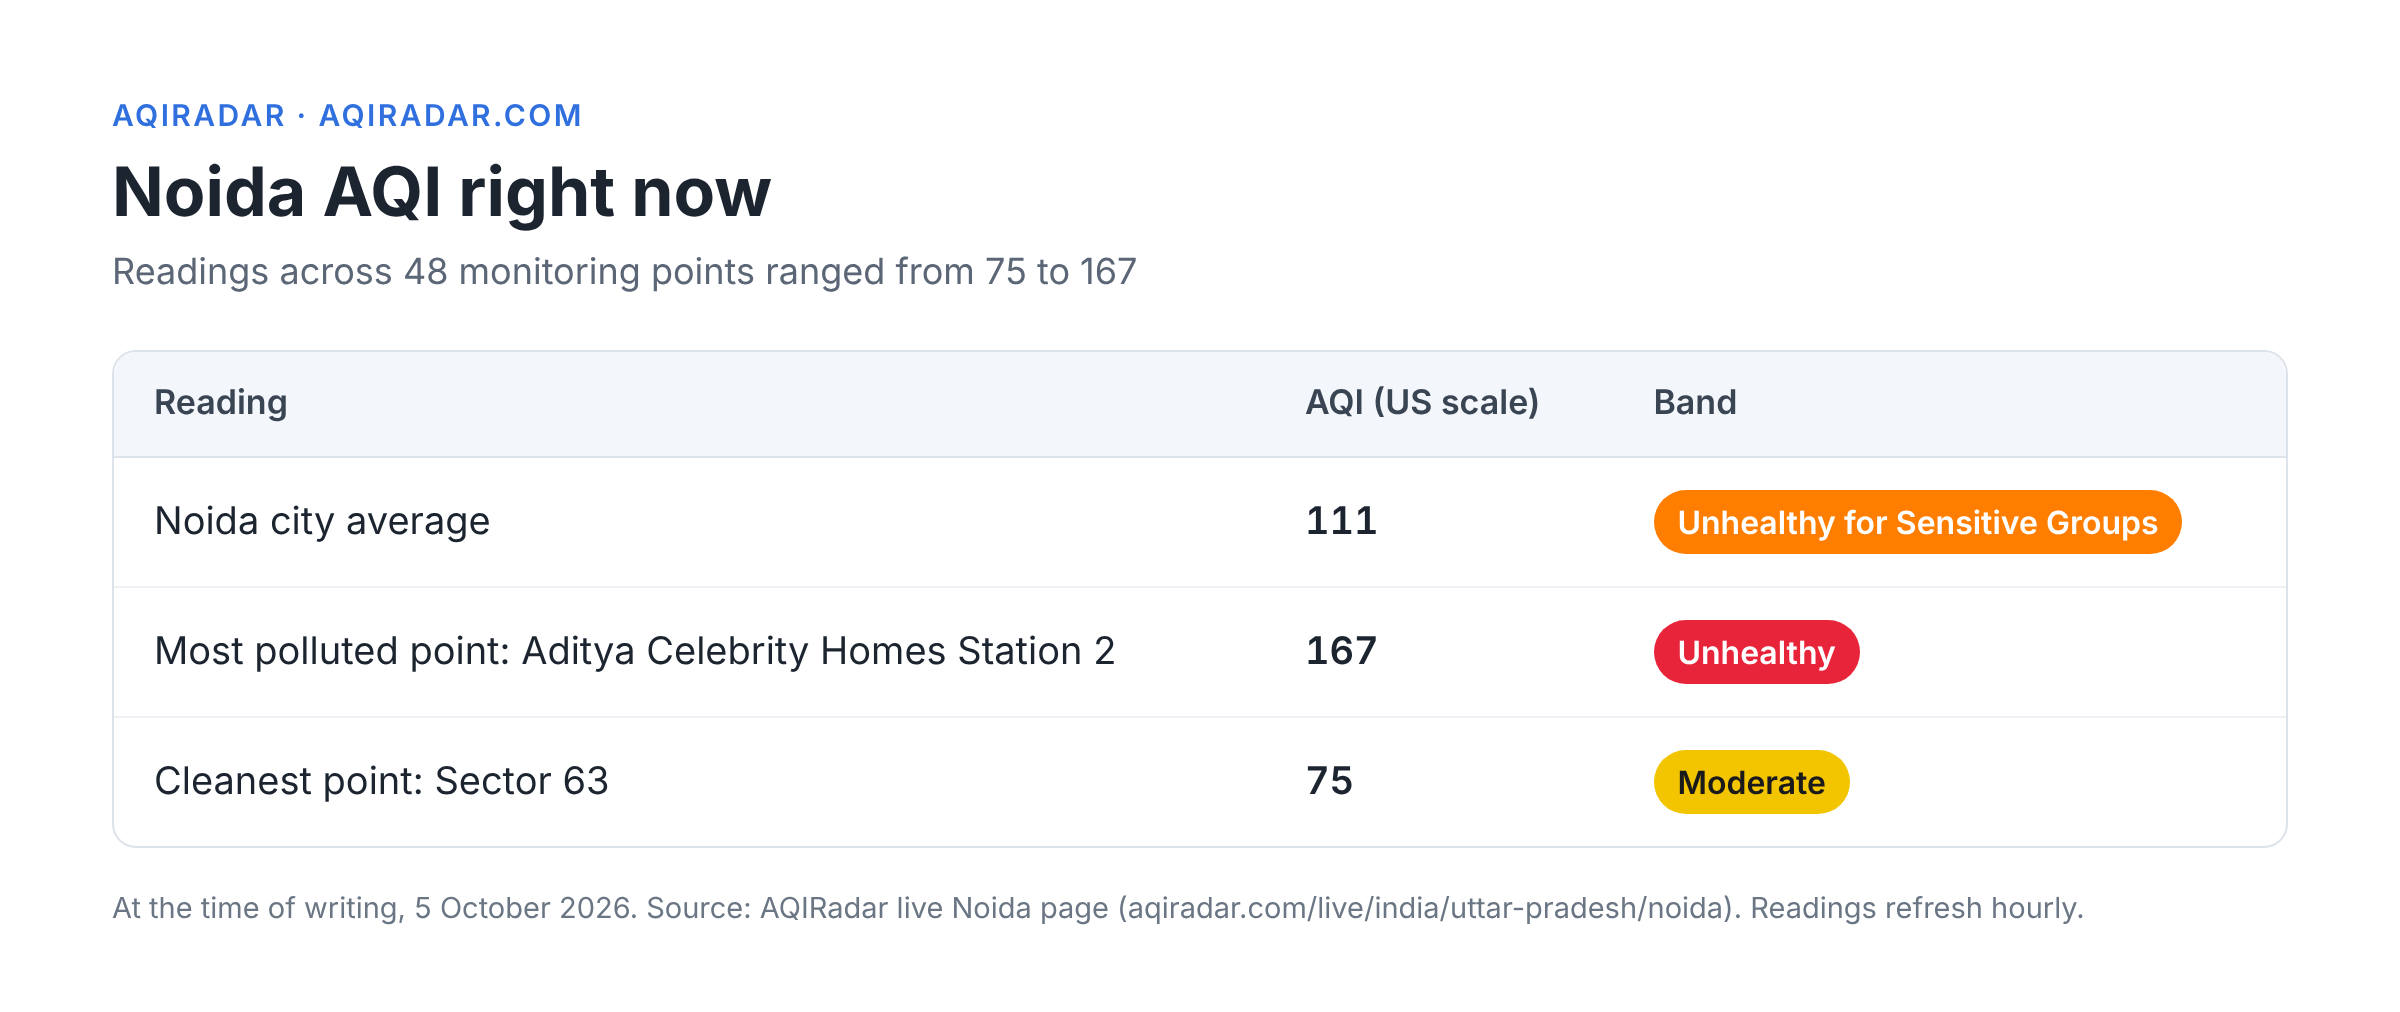
At the time of writing (5 October 2026), AQIRadar's Noida live page showed a city-wide AQI of 111, in the "Unhealthy for Sensitive Groups" band. Readings across 48 monitoring points ranged from 75 to 167:
That spread matters. Two people in the same city can breathe very different air on the same afternoon, depending on traffic, construction and open burning nearby. It is also why AQI apps disagree — see why AQI changes every time you check.
At AQI 111, AQIRadar advises healthy adults to shorten heavy outdoor exertion and take breaks. Children, older adults, pregnant women and people with heart or lung disease should cut back on long outdoor activity. Not sure where you fit? Try the AQI health checker.
How to read Noida AQI: two scales, two numbers
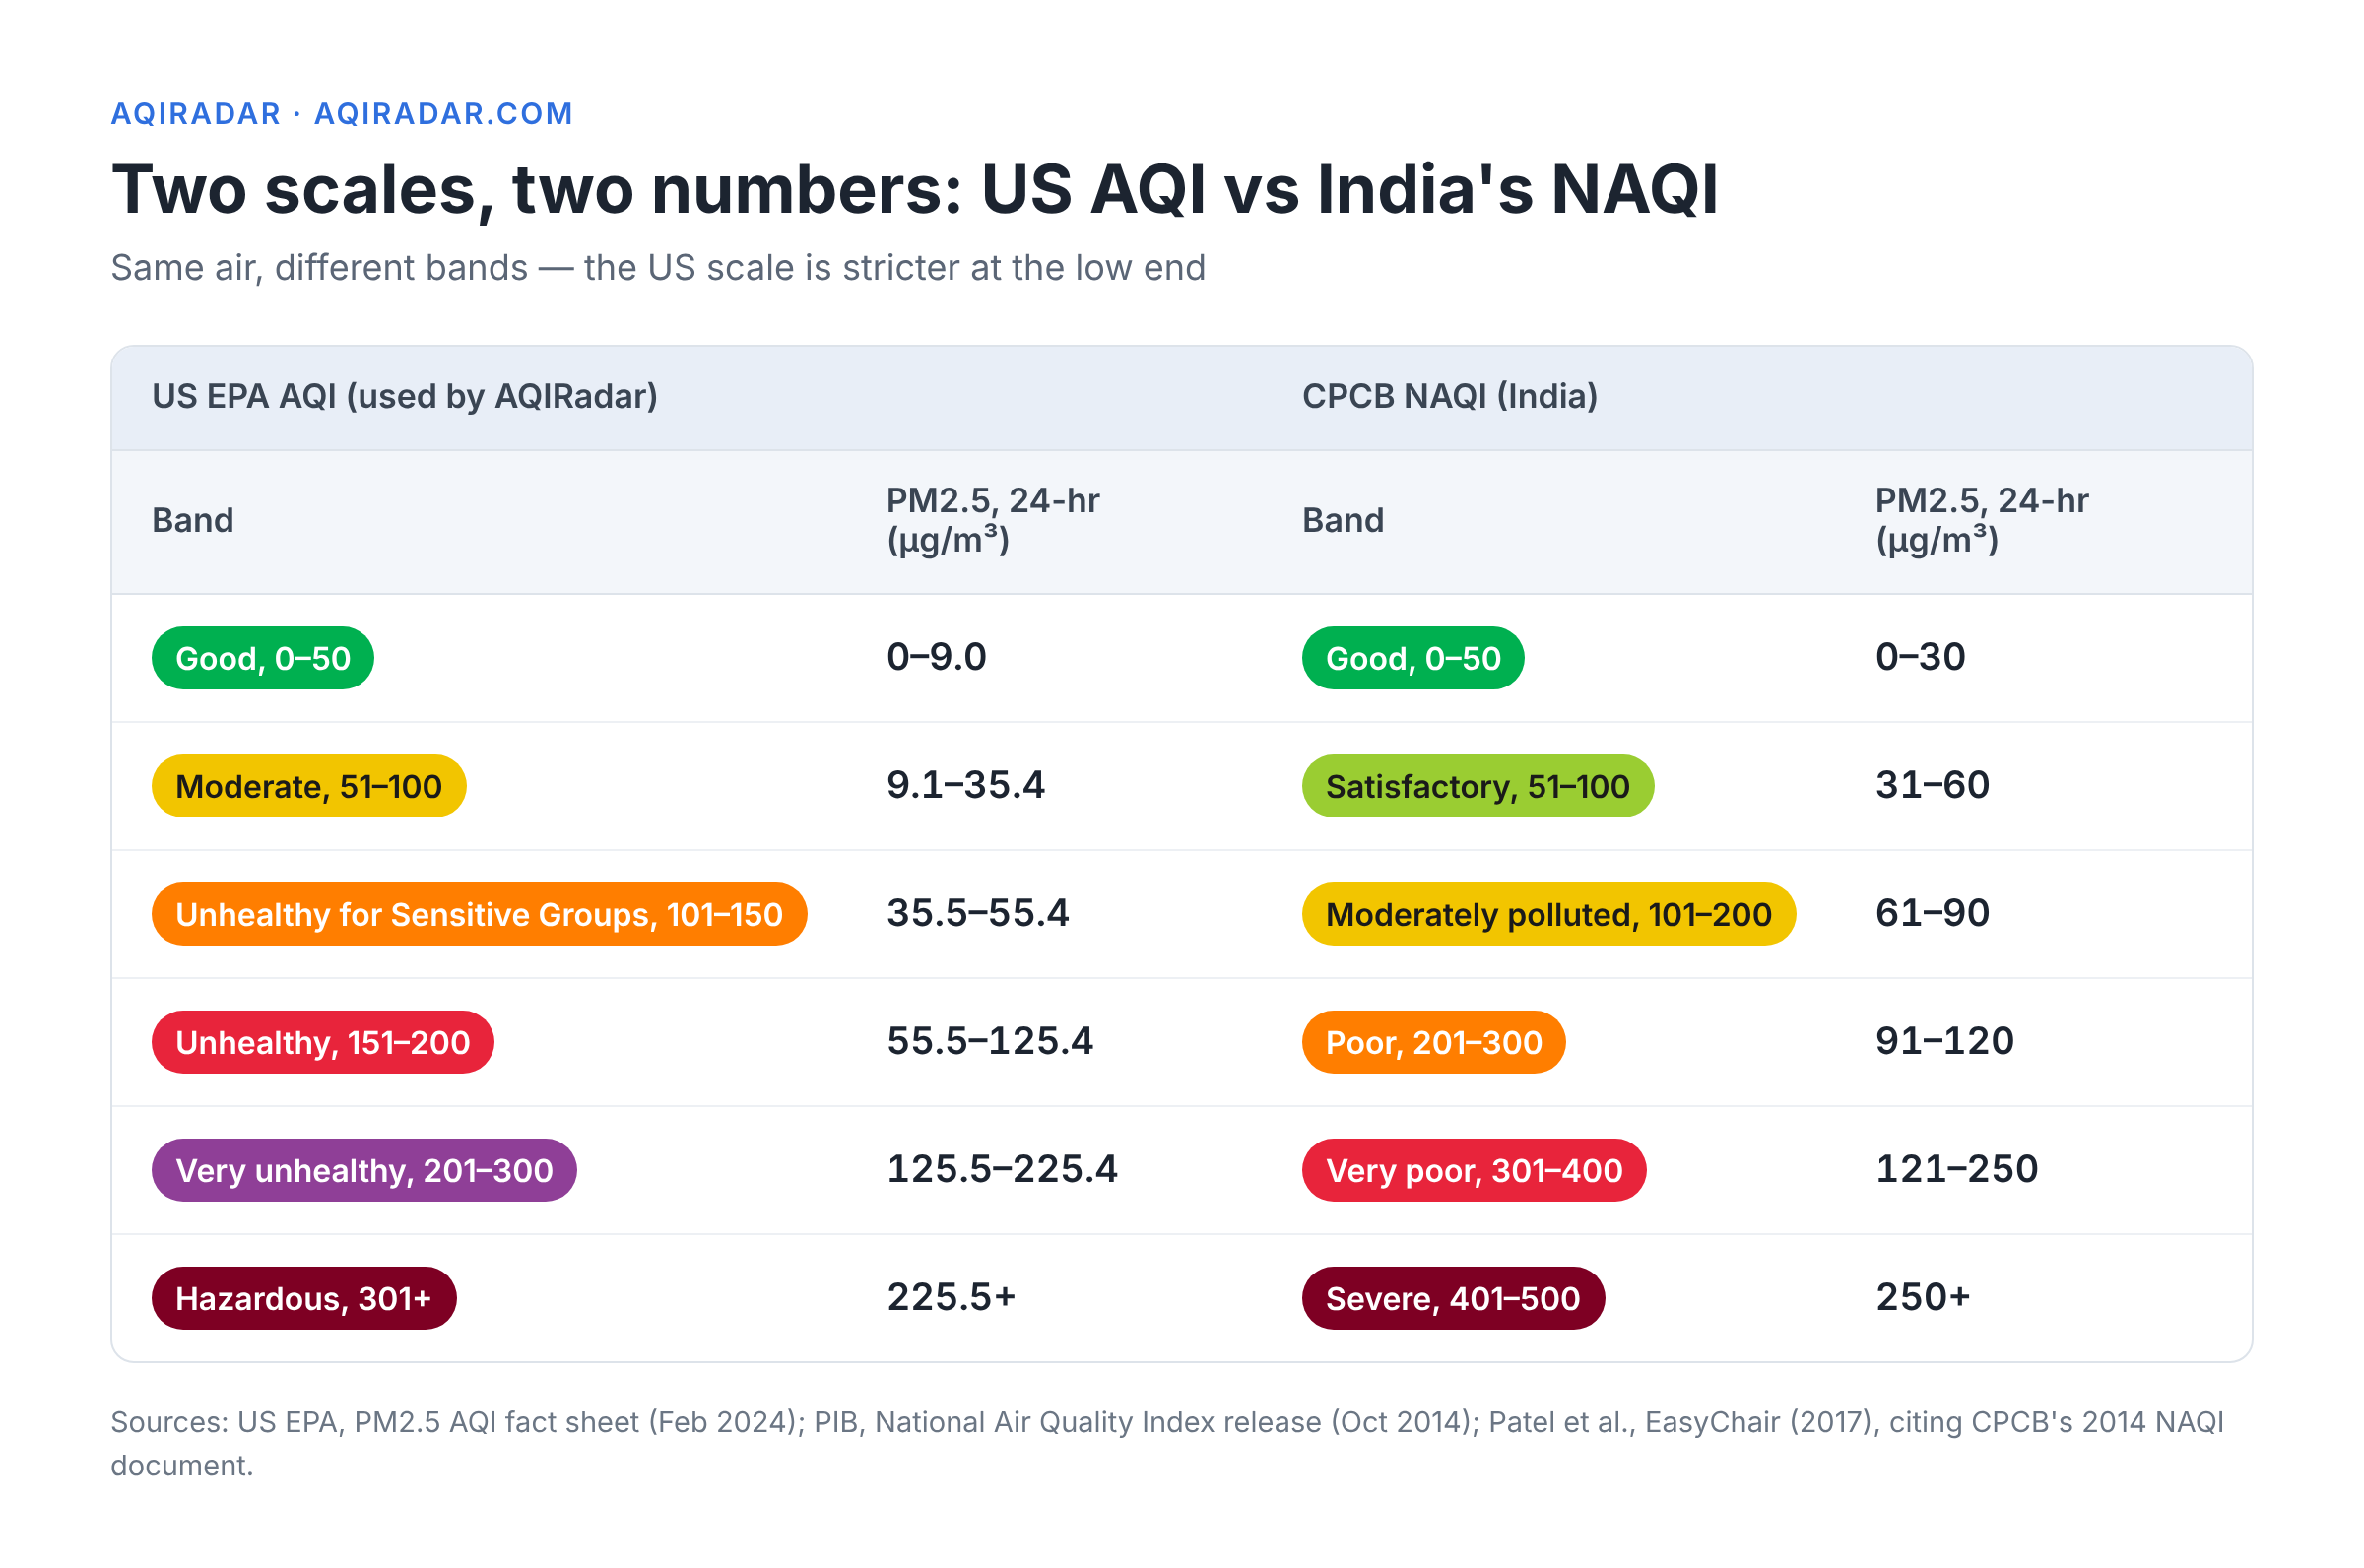
AQIRadar shows the US EPA AQI. Government bulletins and most Indian news reports use the CPCB National Air Quality Index (NAQI). Both run from 0 to 500, but the bands and the PM2.5 cut-offs are different, so the same air can get two different numbers. Our AQI levels page and AQI levels explained go deeper.
Sources: US EPA, 2024 PM2.5 AQI fact sheet; PIB, National Air Quality Index release (category names and ranges); Patel et al., EasyChair, 2017 (CPCB PM2.5 breakpoints, citing CPCB's 2014 NAQI document).
The US scale is stricter at the low end. Today's US AQI of 111 works out to roughly 40 µg/m³ of PM2.5 using the EPA breakpoints (our estimate). On the CPCB scale, 40 µg/m³ is only "Satisfactory". So do not panic if AQIRadar looks worse than a government app — it is the scale, not a mistake. AQI is driven mostly by fine particles; here is the difference between PM2.5 and PM10.
Where Noida pollution comes from
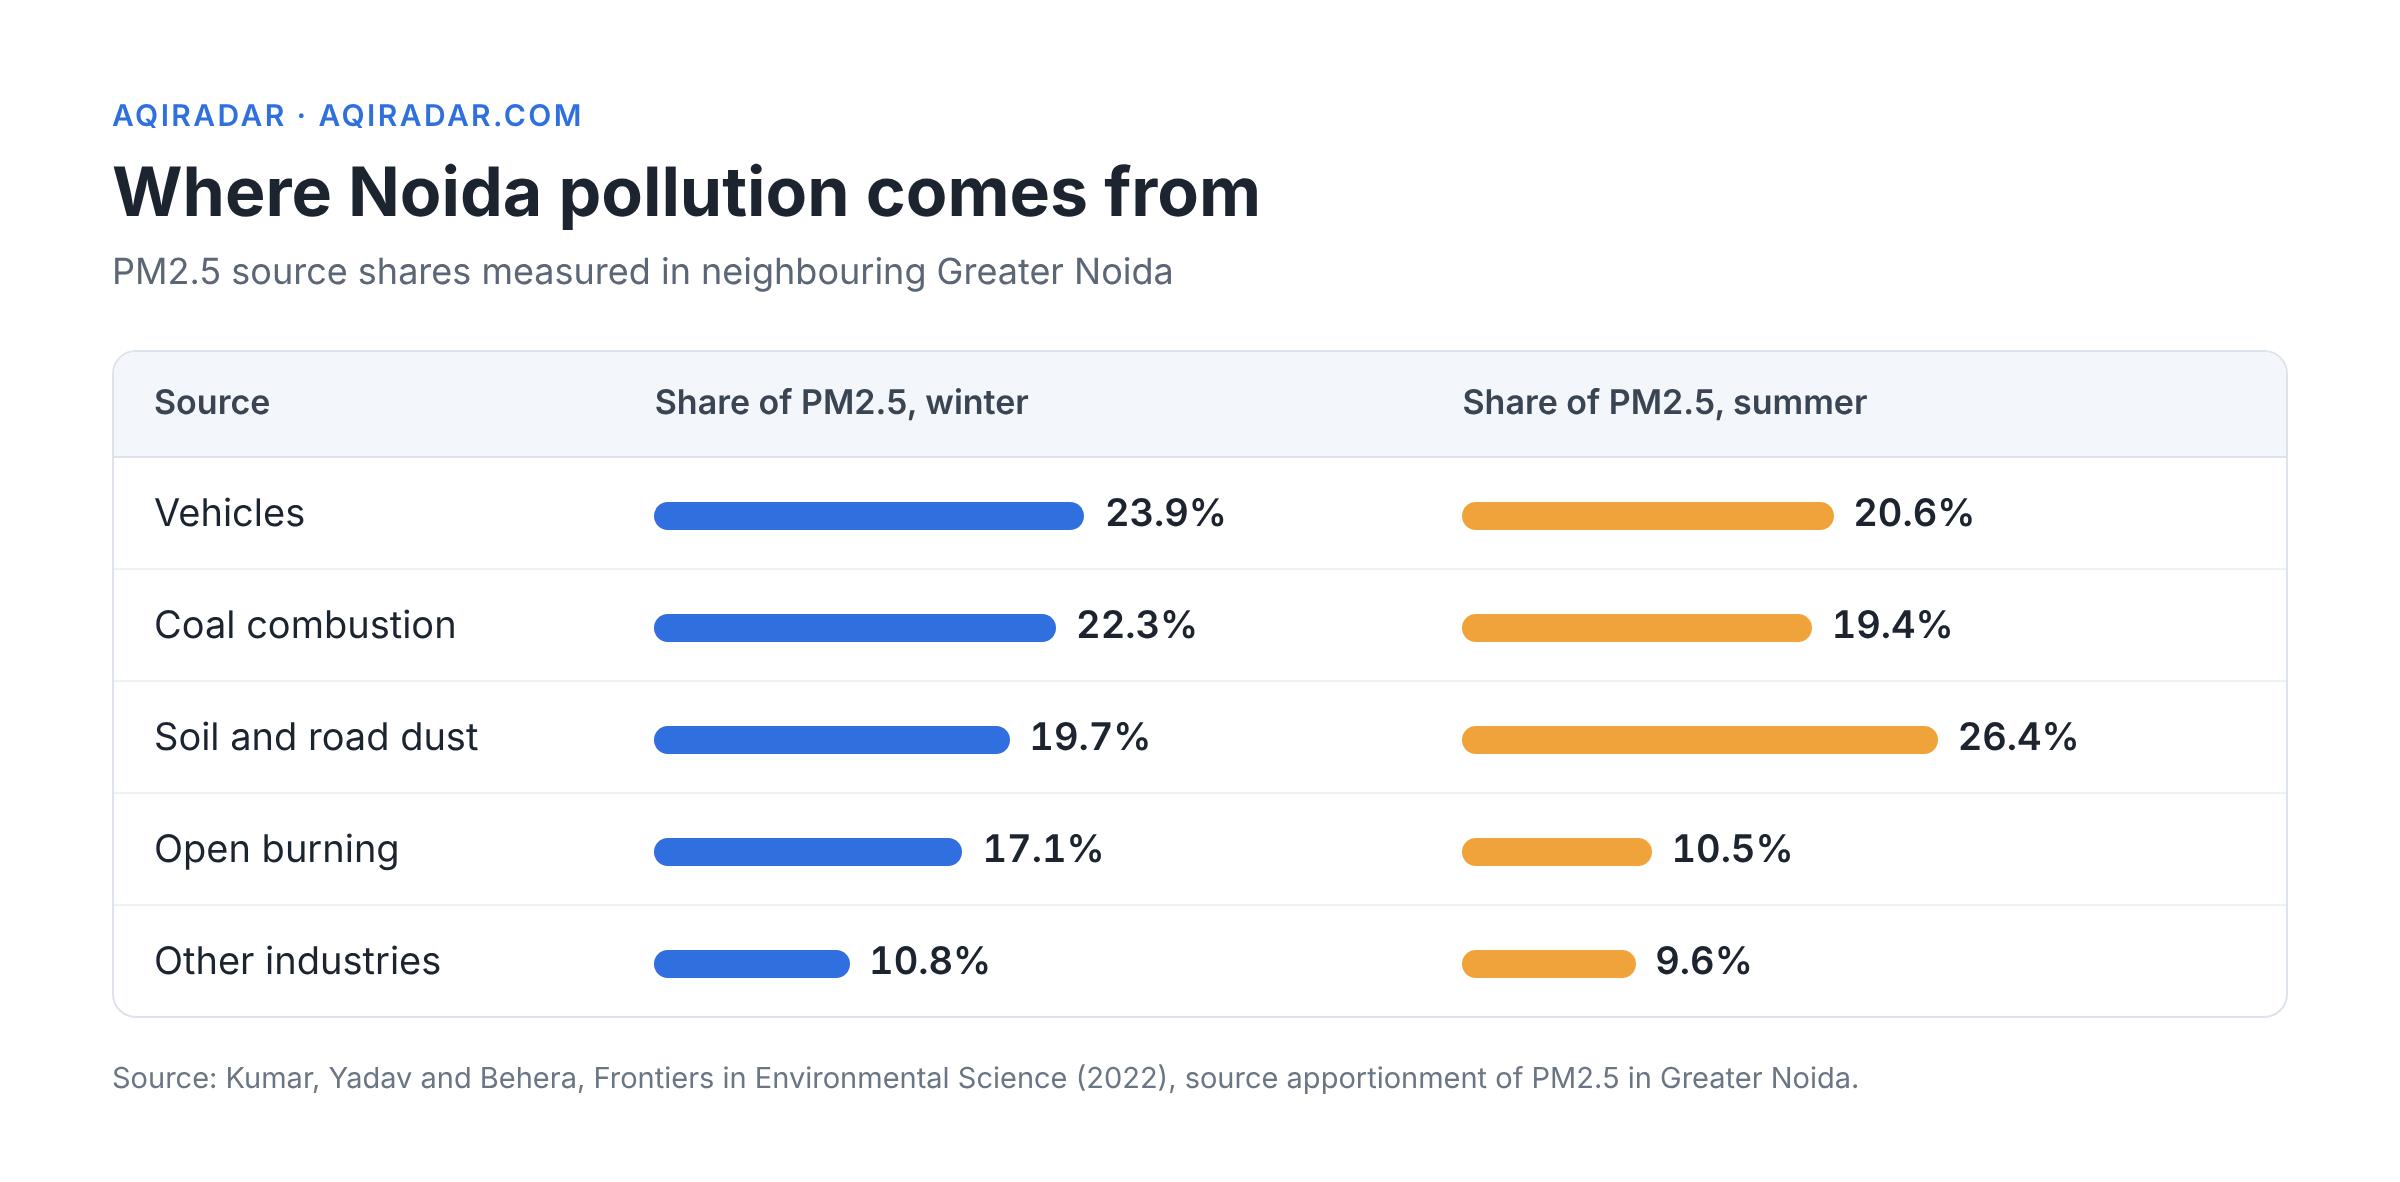
Noida's air is a mix of local smoke and dust plus pollution that drifts in from across the Delhi–NCR airshed. No recent source study covers Noida city alone, but a peer-reviewed study in neighbouring Greater Noida gives a good picture. Kumar, Yadav and Behera (Frontiers in Environmental Science, 2022) traced PM2.5 to these sources:
Source
What this means on the ground:
Traffic. Expressways, arterial roads and daily commuting to Delhi make vehicles the largest winter source.
Dust. Construction sites and broken road edges keep dust in the air, especially in dry months. A January 2026 CAQM inspection of 142 Noida road stretches found high visible dust on 4 and moderate dust on 24.
Burning. Coal and biomass for industry, garbage fires and seasonal crop-residue smoke add to the winter load.
Dust gets most of the clean-up money. A Centre for Science and Environment review reported by Down To Earth (July 2024) found 64% of National Clean Air Programme spending went to road dust, and named Noida among cities that had used less than 40% of their funds.
Seasonal pattern and forecast: what October to January looks like
Noida's air is worst from late October to January. Cold, still nights trap smoke and dust close to the ground, winds slow down, and crop-residue and festival smoke add to local emissions. Rain and stronger winds in summer and the monsoon help clear the air.
The numbers from last winter are stark:
Noida averaged 166 µg/m³ of PM2.5 from 1 October 2025 to 28 February 2026, the second-worst in India after Ghaziabad (172 µg/m³), per a CREA analysis of CPCB data reported by The Wire. India's annual standard is 40 µg/m³.
November is the peak. Next door in Delhi, average PM2.5 doubled from 107 µg/m³ in October 2025 to 215 µg/m³ in November, and 19 of 29 NCR cities breached the daily limit on all 30 days (Tribune, citing CREA, December 2025).
Stubble is not the whole story. The same analysis put stubble burning's share of Delhi's November PM2.5 at 7% in 2025, down from 20% in 2024 — yet the air still got worse. Local sources and weather did most of the damage.
Winter more than doubles exposure. The Greater Noida study above measured PM2.5 of 296 µg/m³ in winter against 114 µg/m³ in summer (Frontiers, 2022).
What to expect this month. As the air worsens, the Commission for Air Quality Management triggers the Graded Response Action Plan (GRAP) across Delhi–NCR, including Noida. Last year Stage I came into force on 14 October 2025, with stricter stages following as AQI rose. Expect Noida AQI to drift upward through October and peak in November.
For a forecast, the Ministry of Earth Sciences' Air Quality Early Warning System, run by IITM Pune, publishes multi-day outlooks for Delhi–NCR. For the wider regional picture, read our explainer on Delhi's smog crisis and check Delhi's current AQI.
Noida pollution hotspots
Pollution in Noida is patchy. At the time of writing, AQIRadar's Noida station list showed these as the highest and lowest readings (US AQI):
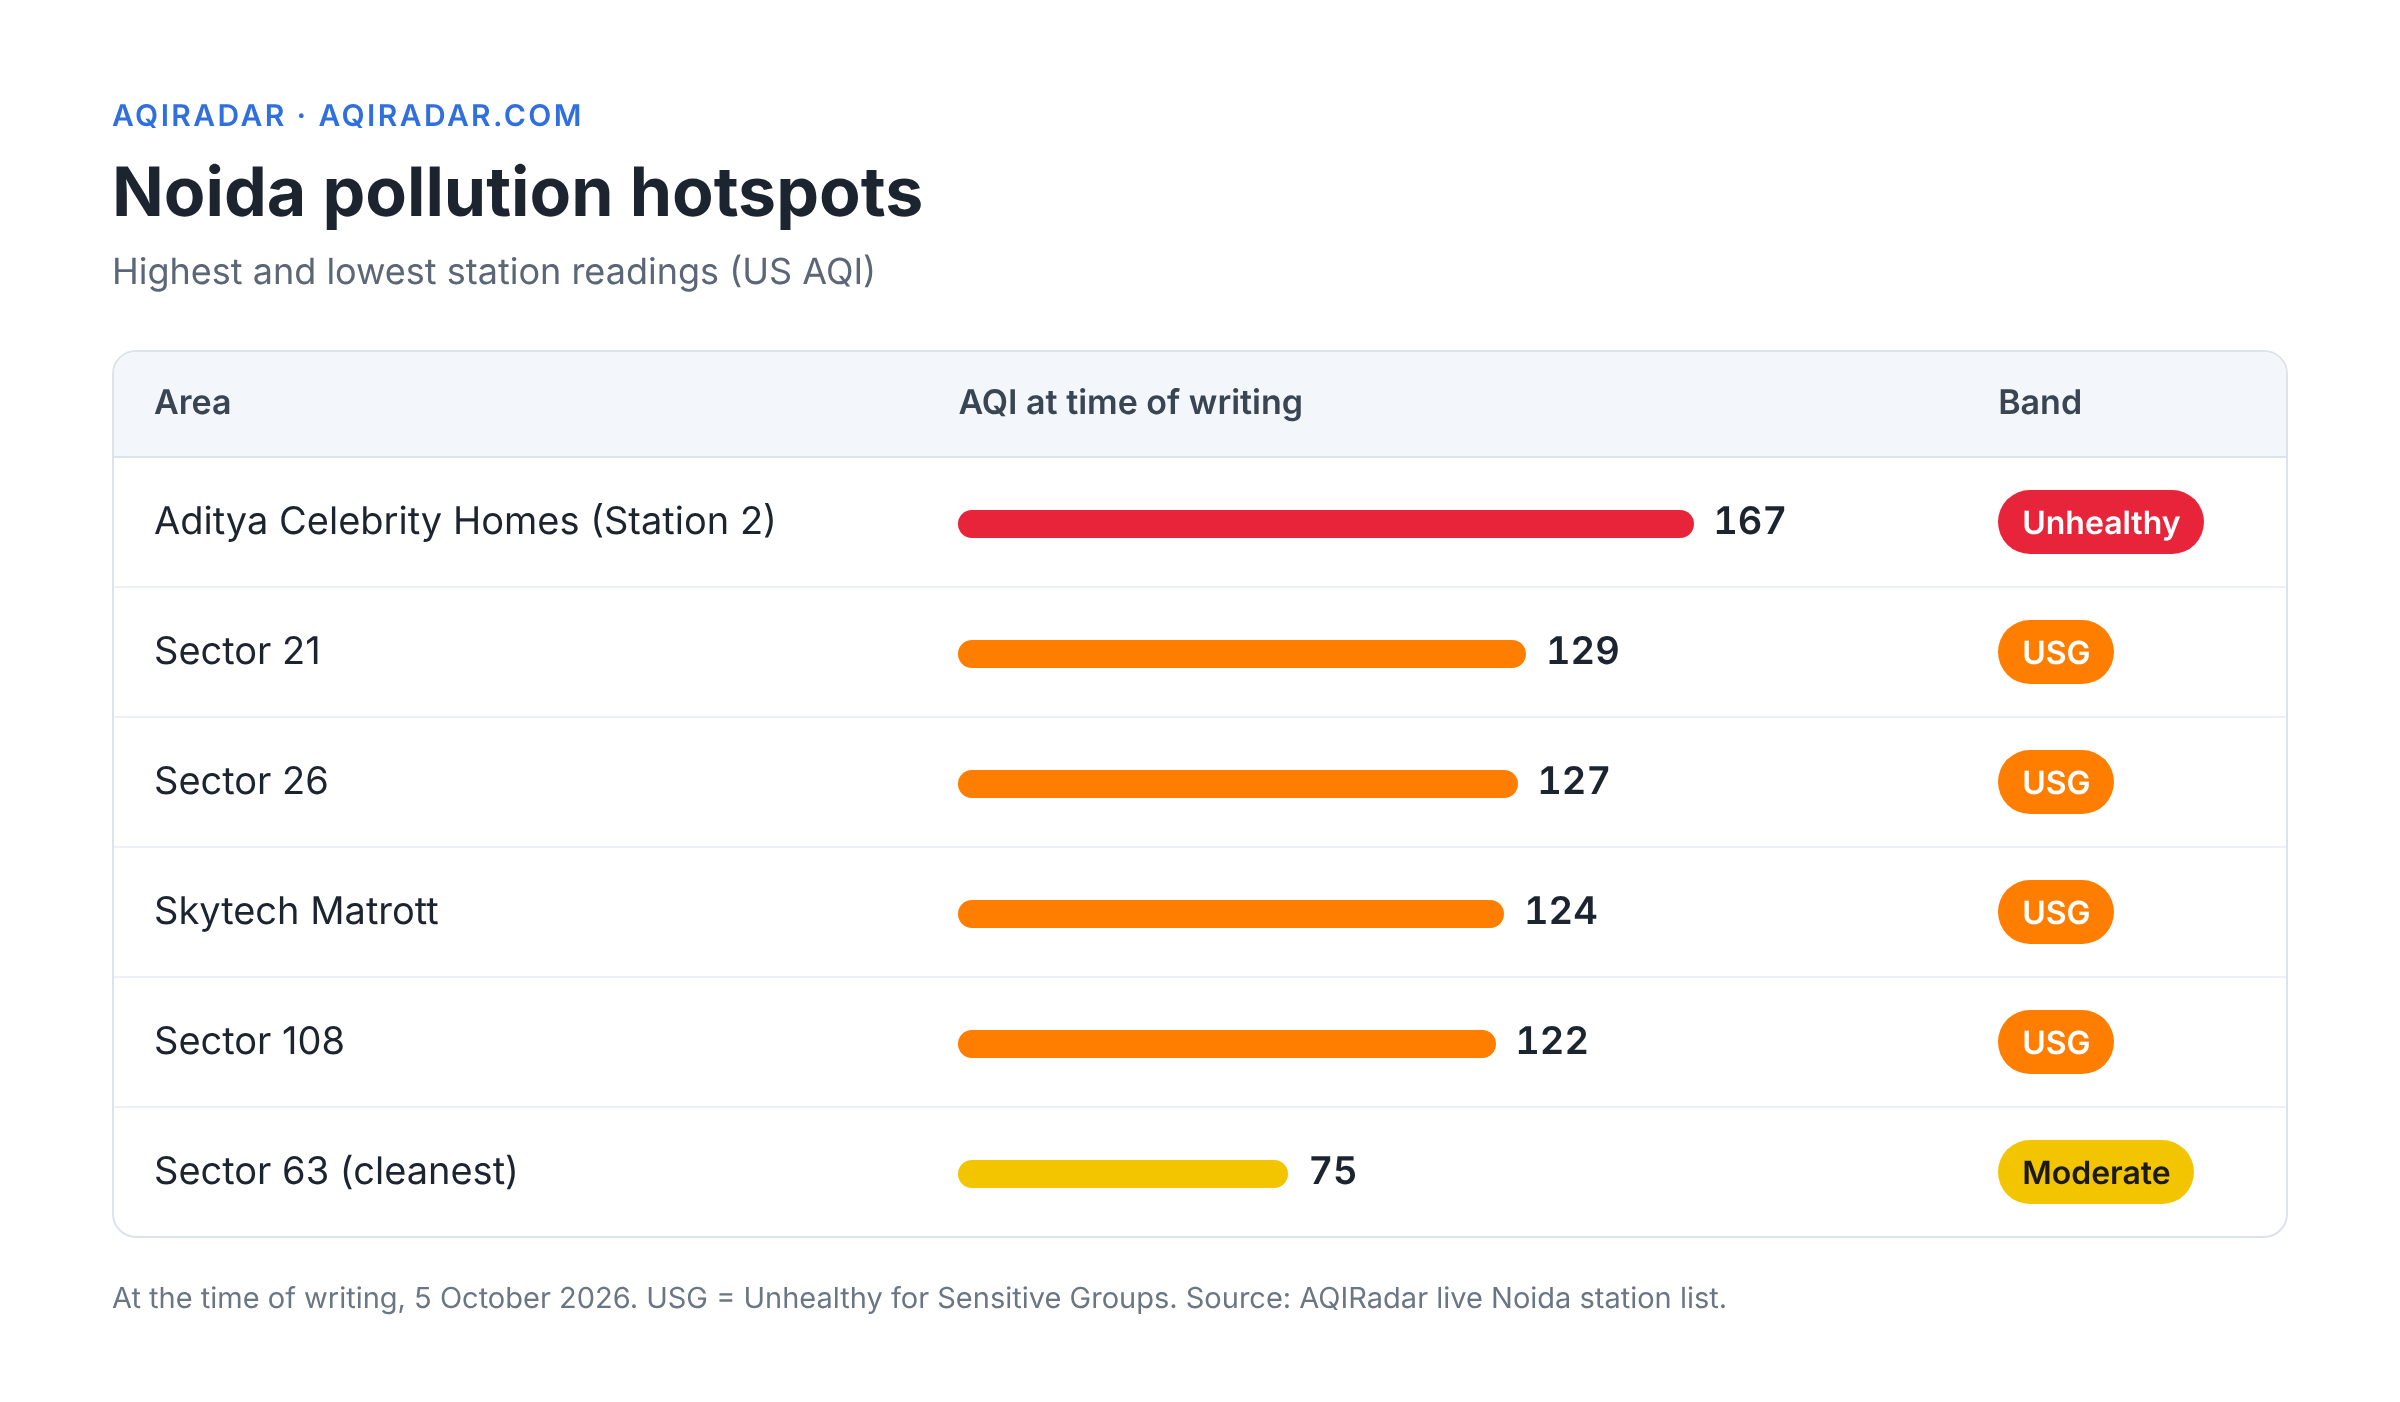
A few patterns are worth knowing:
Older sectors near the Delhi border (such as Sectors 21 and 26) sit close to heavy traffic corridors and often read high.
Construction belts along the expressways and in newer sectors add dust from active sites.
Villages and urban edges such as Haibatpur and Salarpur (both 121–122 at the time of writing) can see waste and biomass burning.
Noida shares one airshed with its neighbours, so compare before you plan your day: Greater Noida AQI read 112 and Ghaziabad 113 at the same time. If you are house-hunting, check a sector's readings over several weeks, not one day — our AQI near you guide shows how.
Health effects, who is at risk, and how to protect yourself
Noida pollution is not just a cough and itchy eyes. Fine PM2.5 particles reach deep into the lungs and bloodstream. The WHO estimates outdoor air pollution caused 4.2 million premature deaths worldwide in 2019; 68% of those were from heart disease and stroke, 14% from COPD, 14% from lower respiratory infections and 4% from lung cancer.
Indian data points the same way. A 2024 Lancet Planetary Health study of 10 Indian cities, reported by ThePrint, linked 7.2% of all deaths to PM2.5 — about 33,000 a year — and found daily deaths rose 1.42% for every 10 µg/m³ rise in PM2.5. Risk rose even below India's own standards. Read more on how AQI affects your heart.
Who is most at risk in Noida:
Children, whose lungs are still growing and who breathe faster
Adults over 60, and anyone with heart disease, diabetes, asthma or COPD
Pregnant women
Outdoor workers, delivery riders, cyclists and long-distance commuters
How to protect yourself:
Check before you step out. Use the live Noida AQI and plan walks and errands for cleaner hours. Our page on whether AQI 150 is good or bad explains what to do at that level.
Wear a well-fitted N95 on bad days. Cloth and surgical masks do little against PM2.5. See masks for daily commuting.
Keep windows shut during peaks — usually late evening to early morning in winter — and avoid frying or burning incense then. Here is how to reduce PM2.5 inside your home.
Run a HEPA purifier where you sleep. Size it to your room with the air purifier calculator, then compare air purifiers for bedrooms.
Move exercise indoors when AQI crosses 150, and keep runs away from main roads.
Want a gut-check on a bad day? The AQI to cigarettes calculator turns a reading into something easier to picture.
Frequently asked questions
What is the Noida AQI today? At the time of writing (5 October 2026) it was 111 on the US scale, "Unhealthy for Sensitive Groups". It changes every hour, so check the live Noida AQI page for the current number.
Why does AQIRadar show a different number from the government's Sameer app? AQIRadar uses the US EPA scale, while CPCB uses India's NAQI. The US scale has lower PM2.5 cut-offs, so the same air usually gets a higher number on AQIRadar.
Which month has the worst air in Noida? November is typically the peak; in neighbouring Delhi, PM2.5 doubled from 107 µg/m³ in October 2025 to 215 µg/m³ in November (Tribune). Over the full winter, Noida averaged 166 µg/m³ of PM2.5 between October and February, second-worst in India (The Wire, citing CREA).
Is Noida more polluted than Delhi? They share one airshed and usually move together. Over winter 2025–26, Noida averaged 166 µg/m³ of PM2.5 against Delhi's 163 µg/m³ in CREA's ranking (The Wire).
What is the main cause of Noida pollution? There is no single cause. In a Greater Noida study, vehicles, coal combustion, road dust and open burning each contributed roughly 17–24% of winter PM2.5 (Frontiers, 2022).
Is it safe to go for a morning walk in Noida? Below AQI 100, yes for most people. Between 100 and 150, sensitive groups should keep it short. In winter, mornings are often the worst hours, so check the live reading first.
Related reading on AQIRadar
Delhi's air quality crisis: what's behind the smog and how to stay safe
AQI levels explained: what each colour means for your health
Sources
AQIRadar — Noida live air quality, accessed 5 October 2026
Deccan Herald — Delhi continues to choke, several areas cross AQI of 400, 24 November 2025
US EPA — Final updates to the Air Quality Index for particulate matter (fact sheet), February 2024
Press Information Bureau — National Air Quality Index release, 17 October 2014
Patel, Salvi and Patel (EasyChair) — Ambient air quality assessment using Air Quality Index of Delhi, 2017
Kumar, Yadav and Behera (Frontiers in Environmental Science) — PM2.5-bound trace elements, source apportionment and health risks in Greater Noida, 2022
AIR News (newsonair.gov.in) — CAQM conducts inspection drive on 142 road stretches in Noida, 6 January 2026
Down To Earth — Delhi, Noida among cities with less than 40% NCAP fund utilisation: CSE assessment, 19 July 2024
The Wire — Winter pollution spiked across India in 2025–26: Ghaziabad, Noida, Delhi fared worst, 8 March 2026
The Tribune — Despite dip in stubble burning, air quality worsened in November, 7 December 2025
AIR News (newsonair.gov.in) — Delhi-NCR implements GRAP Stage I to tackle worsening air quality, 14 October 2025
IITM Pune / Ministry of Earth Sciences — Air Quality Early Warning System, accessed 5 October 2026
World Health Organization — Ambient (outdoor) air quality and health fact sheet, 24 October 2024
ThePrint — Air pollution linked with 33,000 deaths in India each year between 2008 & 2019, finds Lancet study, 4 July 2024