11 October 2026 · Faheem M
Hyderabad AQI: Current Air Quality & Pollution Guide
Hyderabad's AQI was 114 – Unhealthy for Sensitive Groups – on 10 October 2026. Learn how to read the number, what pollutes the city's air, which areas like Pashamylaram and Sanathnagar are worst, why November peaks, and how to protect your family.

Hyderabad AQI right now
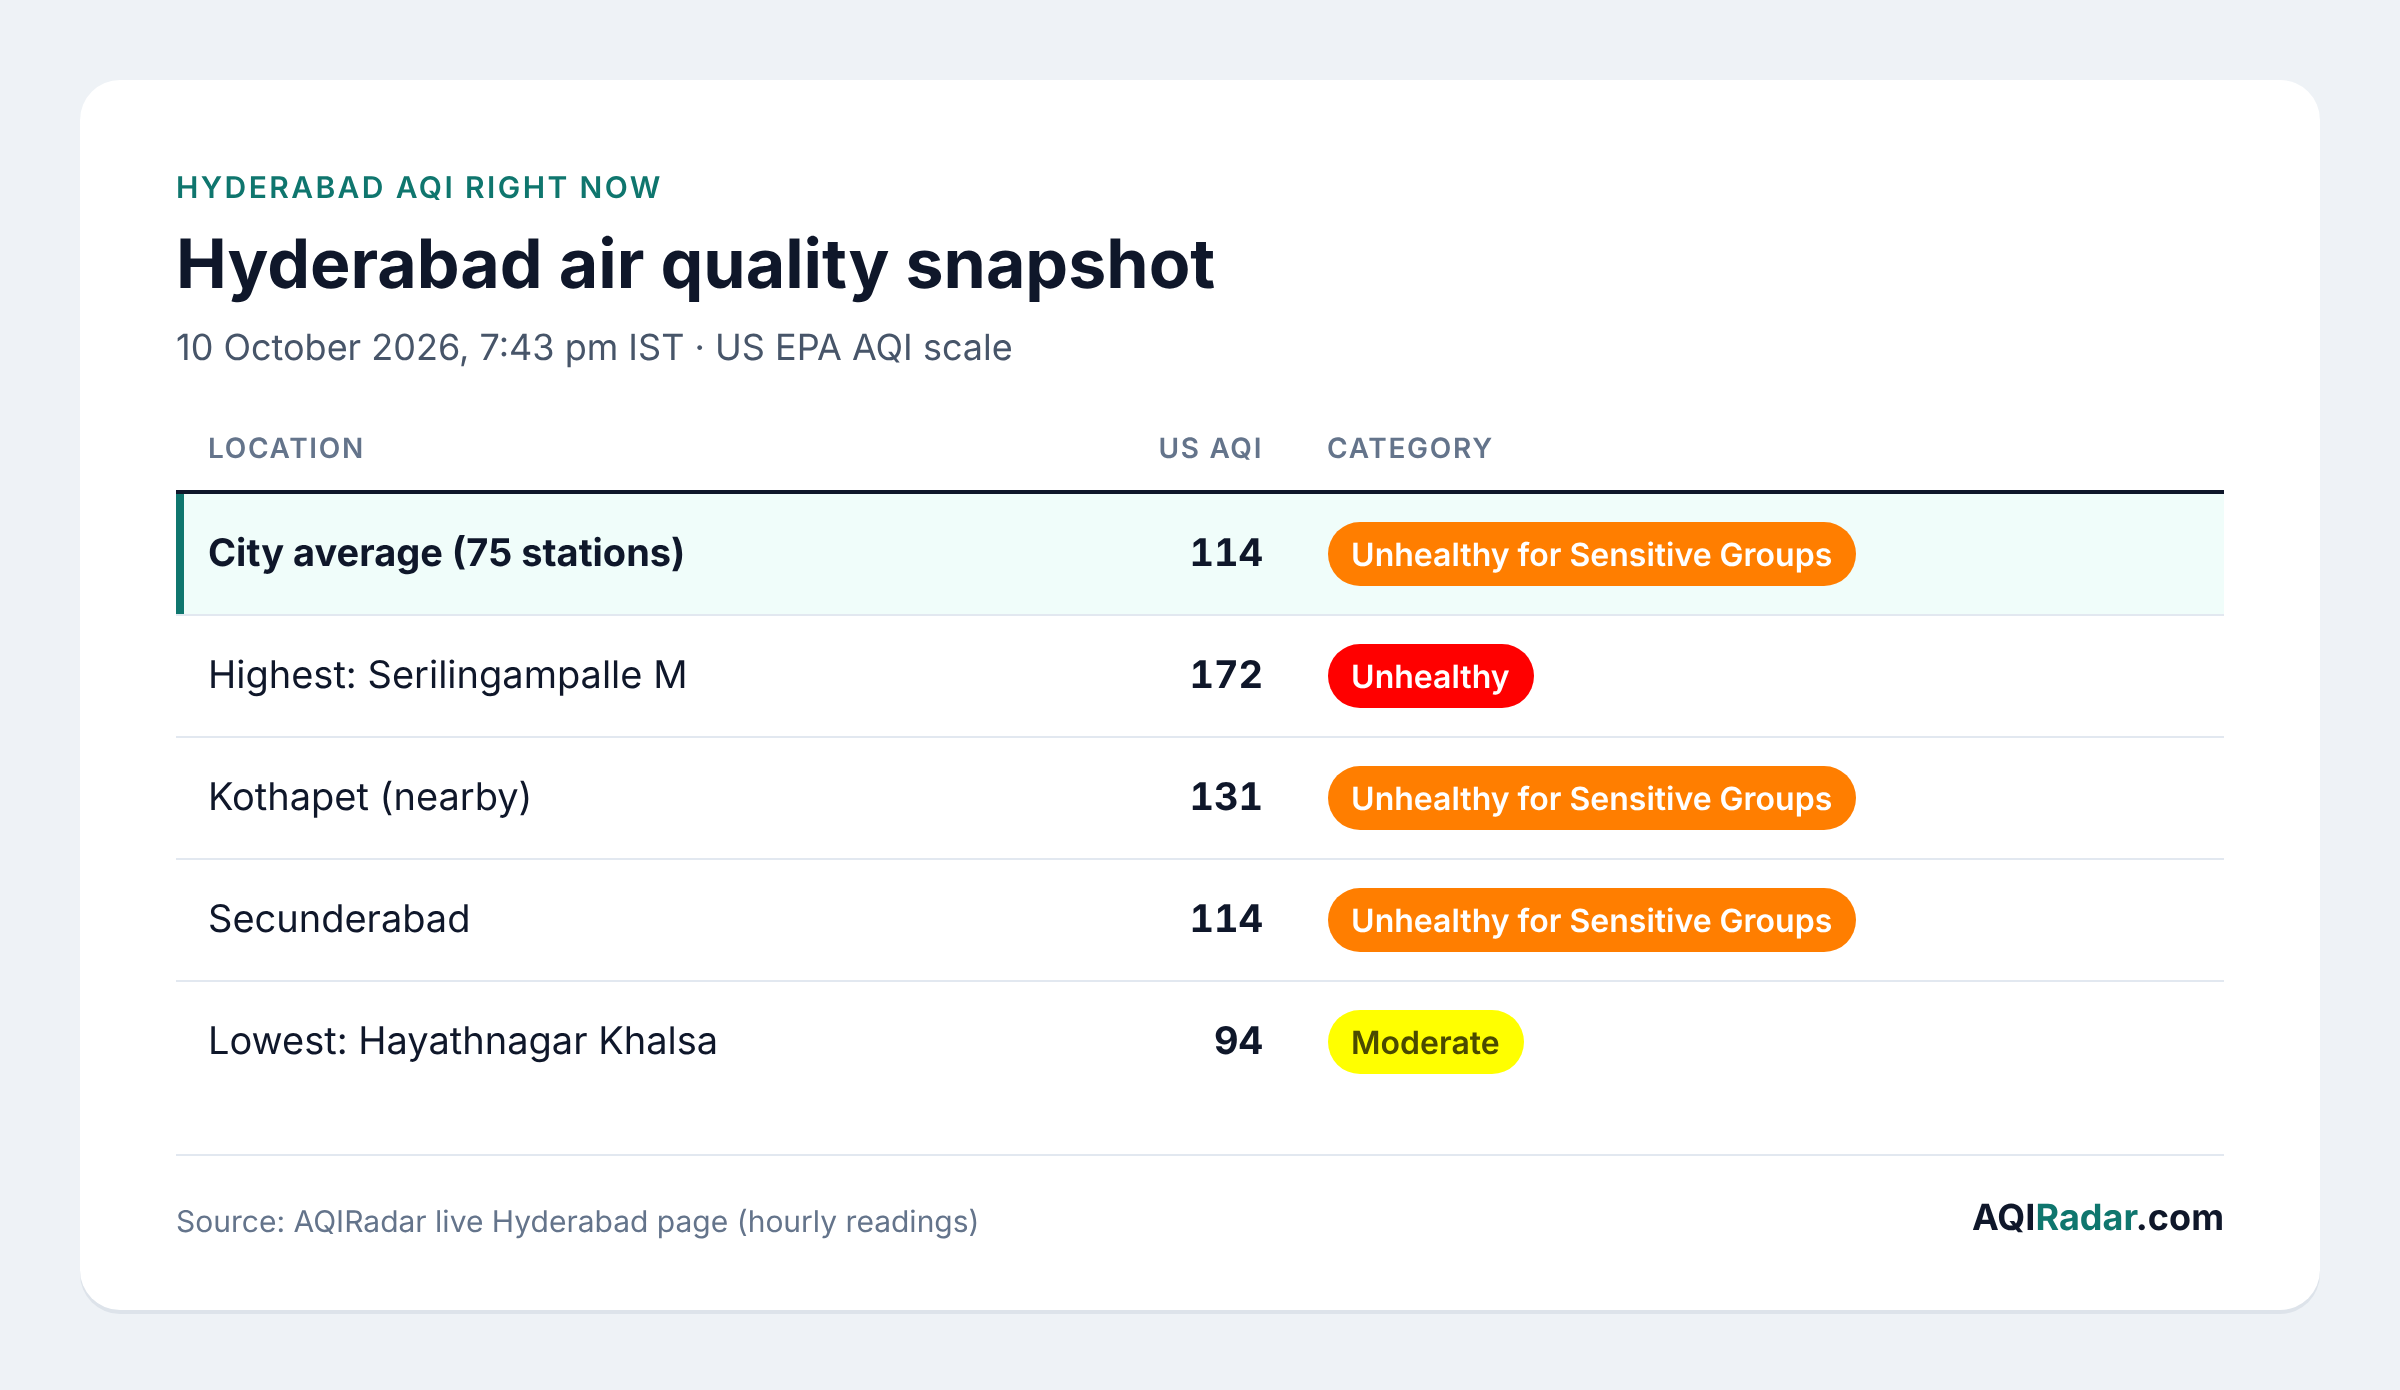
At the time of writing (7:43 pm IST, 10 October 2026), the average Hyderabad AQI was 114 – "Unhealthy for Sensitive Groups" on the US EPA scale, across 75 reporting stations on AQIRadar's live Hyderabad page. Healthy adults are mostly fine at this level, but children, older people and anyone with asthma or heart disease should cut back on long outdoor exertion.
Readings varied a lot across the city. The worst station, Serilingampalle M, showed AQI 172 (Unhealthy), while Hayathnagar Khalsa was the cleanest at 94 (AQIRadar). That gap is why a single city number can mislead you. Check the station nearest your home on the live air quality map, or use AQI near you to find it quickly.
Numbers update hourly, so treat this as a snapshot. If the AQI you see is 100 or 150 and you are unsure what it means, our guides on whether AQI 100 is good or bad and whether AQI 150 is good or bad explain each level.
How to read Hyderabad's AQI: US scale vs India's scale
The same air can show two very different numbers, because AQIRadar uses the US EPA AQI while Indian government apps use CPCB's National Air Quality Index (NAQI). The US scale is stricter for PM2.5: it calls 35.5 µg/m³ "Unhealthy for Sensitive Groups" (US EPA), while India's scale still counts up to 60 µg/m³ as "Satisfactory" (CPCB).
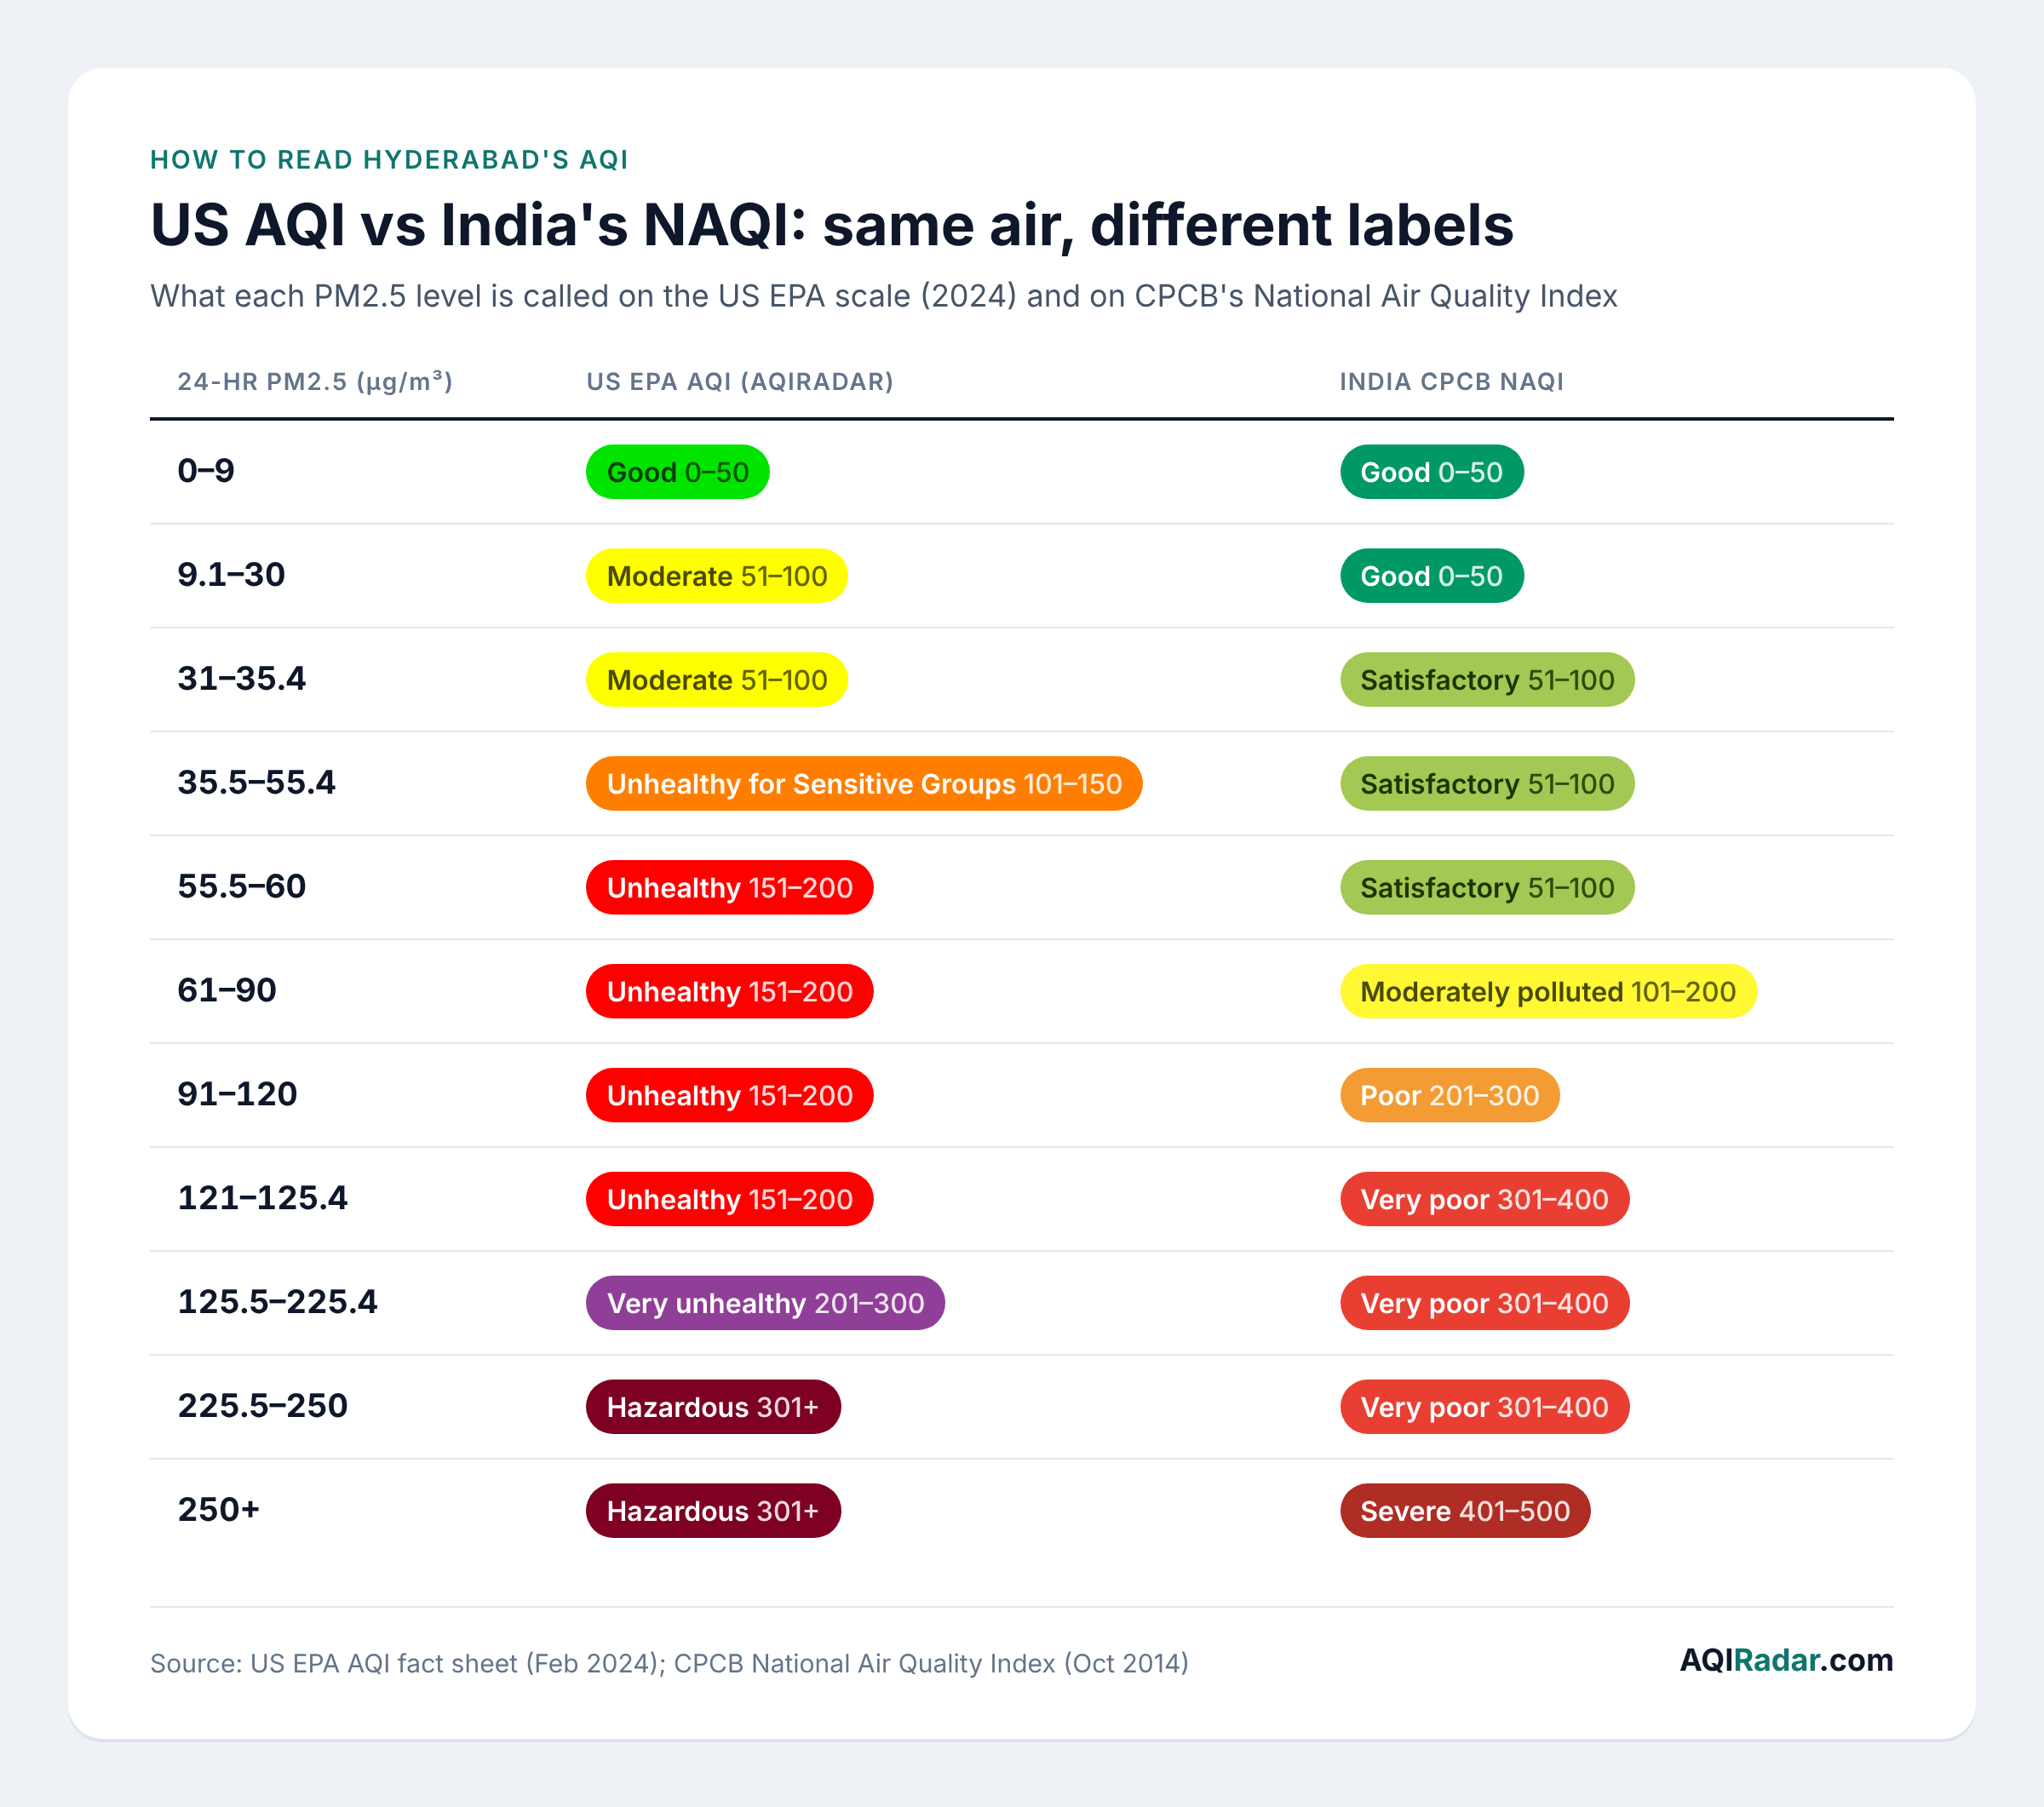
So Hyderabad's "114" on AQIRadar means PM2.5 of roughly 40 µg/m³. On the CPCB Sameer app the same air would read as "Satisfactory". Neither is wrong; they set the bar in different places. For reference, the WHO's 2021 guideline for PM2.5 is 5 µg/m³ as a yearly average and 15 µg/m³ over 24 hours (Greenpeace India on WHO guidelines).
Numbers also differ between monitors. In November 2024, Telangana's pollution board showed AQI 318 at Pashamylaram while the CPCB Sameer app showed 158 for the same day (Deccan Chronicle). Read more in AQI levels explained and why AQI changes every time you check.
Main pollution sources in Hyderabad
Hyderabad's dirty air comes mostly from industry, dust and traffic. UrbanEmissions.info estimated the city's 2018 PM2.5 emissions at 34,750 tonnes a year, broken down like this (UrbanEmissions.info):
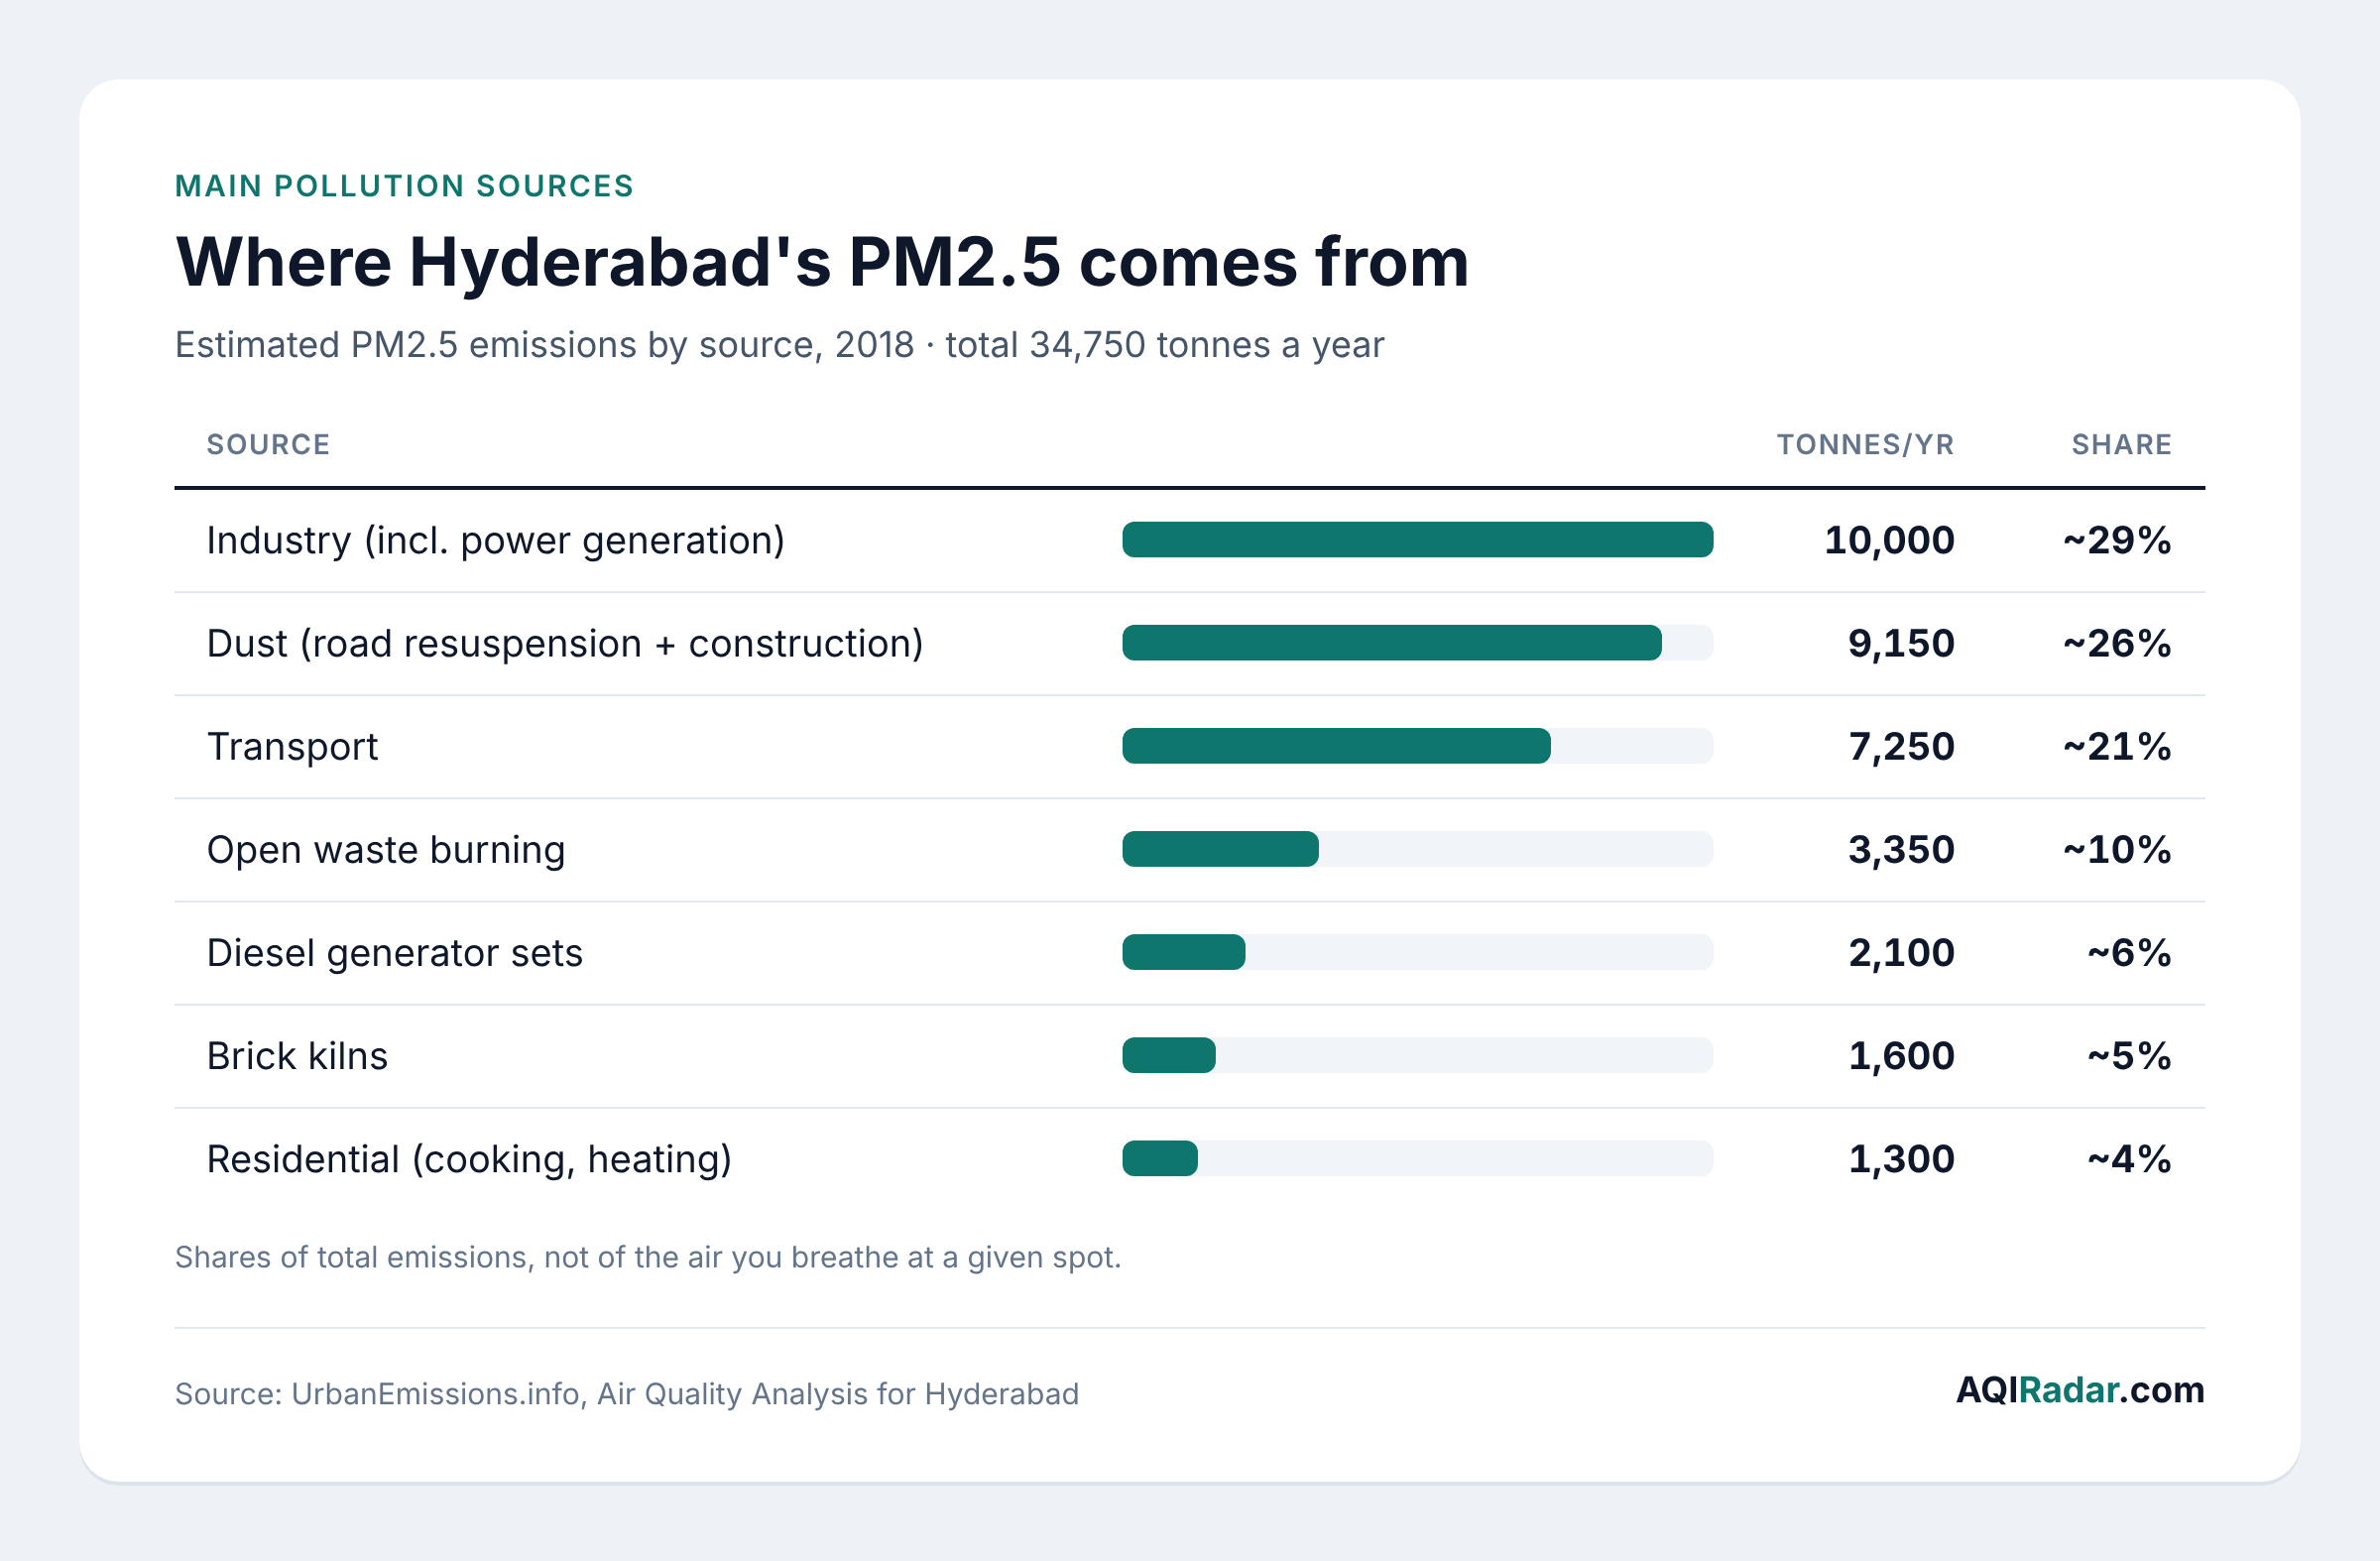
These are shares of what is emitted, not of what you breathe at a given spot. Near a highway, exhaust matters more. Near the Patancheru–Pashamylaram industrial belt, factories dominate. An older 2006 study cited by the same source put vehicle exhaust at about 30% and road dust at 30–45% of particulate pollution.
Industry. The western and north-western edges of the city hold large industrial estates. IDA Pashamylaram, Bollaram and ICRISAT Patancheru all sit among the city's most polluted stations (see the hotspots section below).
Dust and construction. Fast growth in the IT corridor means constant digging, building and unpaved shoulders. Road-dust control is one of the main measures Telangana's air quality monitoring committee reviewed in October 2026 (UNI).
Vehicles. Traffic is the source most people breathe up close, every day. Diesel trucks, older two-wheelers and idling in jams all add fine particles and NO₂. To understand the particle sizes involved, see our guide to the difference between PM2.5 and PM10.
Seasonal pattern and what to expect this winter
Hyderabad's air is cleanest during the monsoon and worst from late October to January, with November usually the peak. Rain washes particles out of the air, so levels usually dip in the monsoon (UrbanEmissions.info). In winter, cooler nights create temperature inversions that trap smoke and exhaust near the ground.
You can see this in the data. On 2 December 2025, cold nights pushed Hyderabad's AQI to 164, and minimum temperatures in areas like Maredpally fell to 17°C (Siasat). The Centre for Science and Environment (CSE) found that November was the worst month of winter 2024–25 in Hyderabad, as it was in Delhi (CSE).
How Hyderabad compares. CSE's analysis of winter 2024–25 (1 October to 31 January) put Hyderabad third among India's six megacities (CSE):
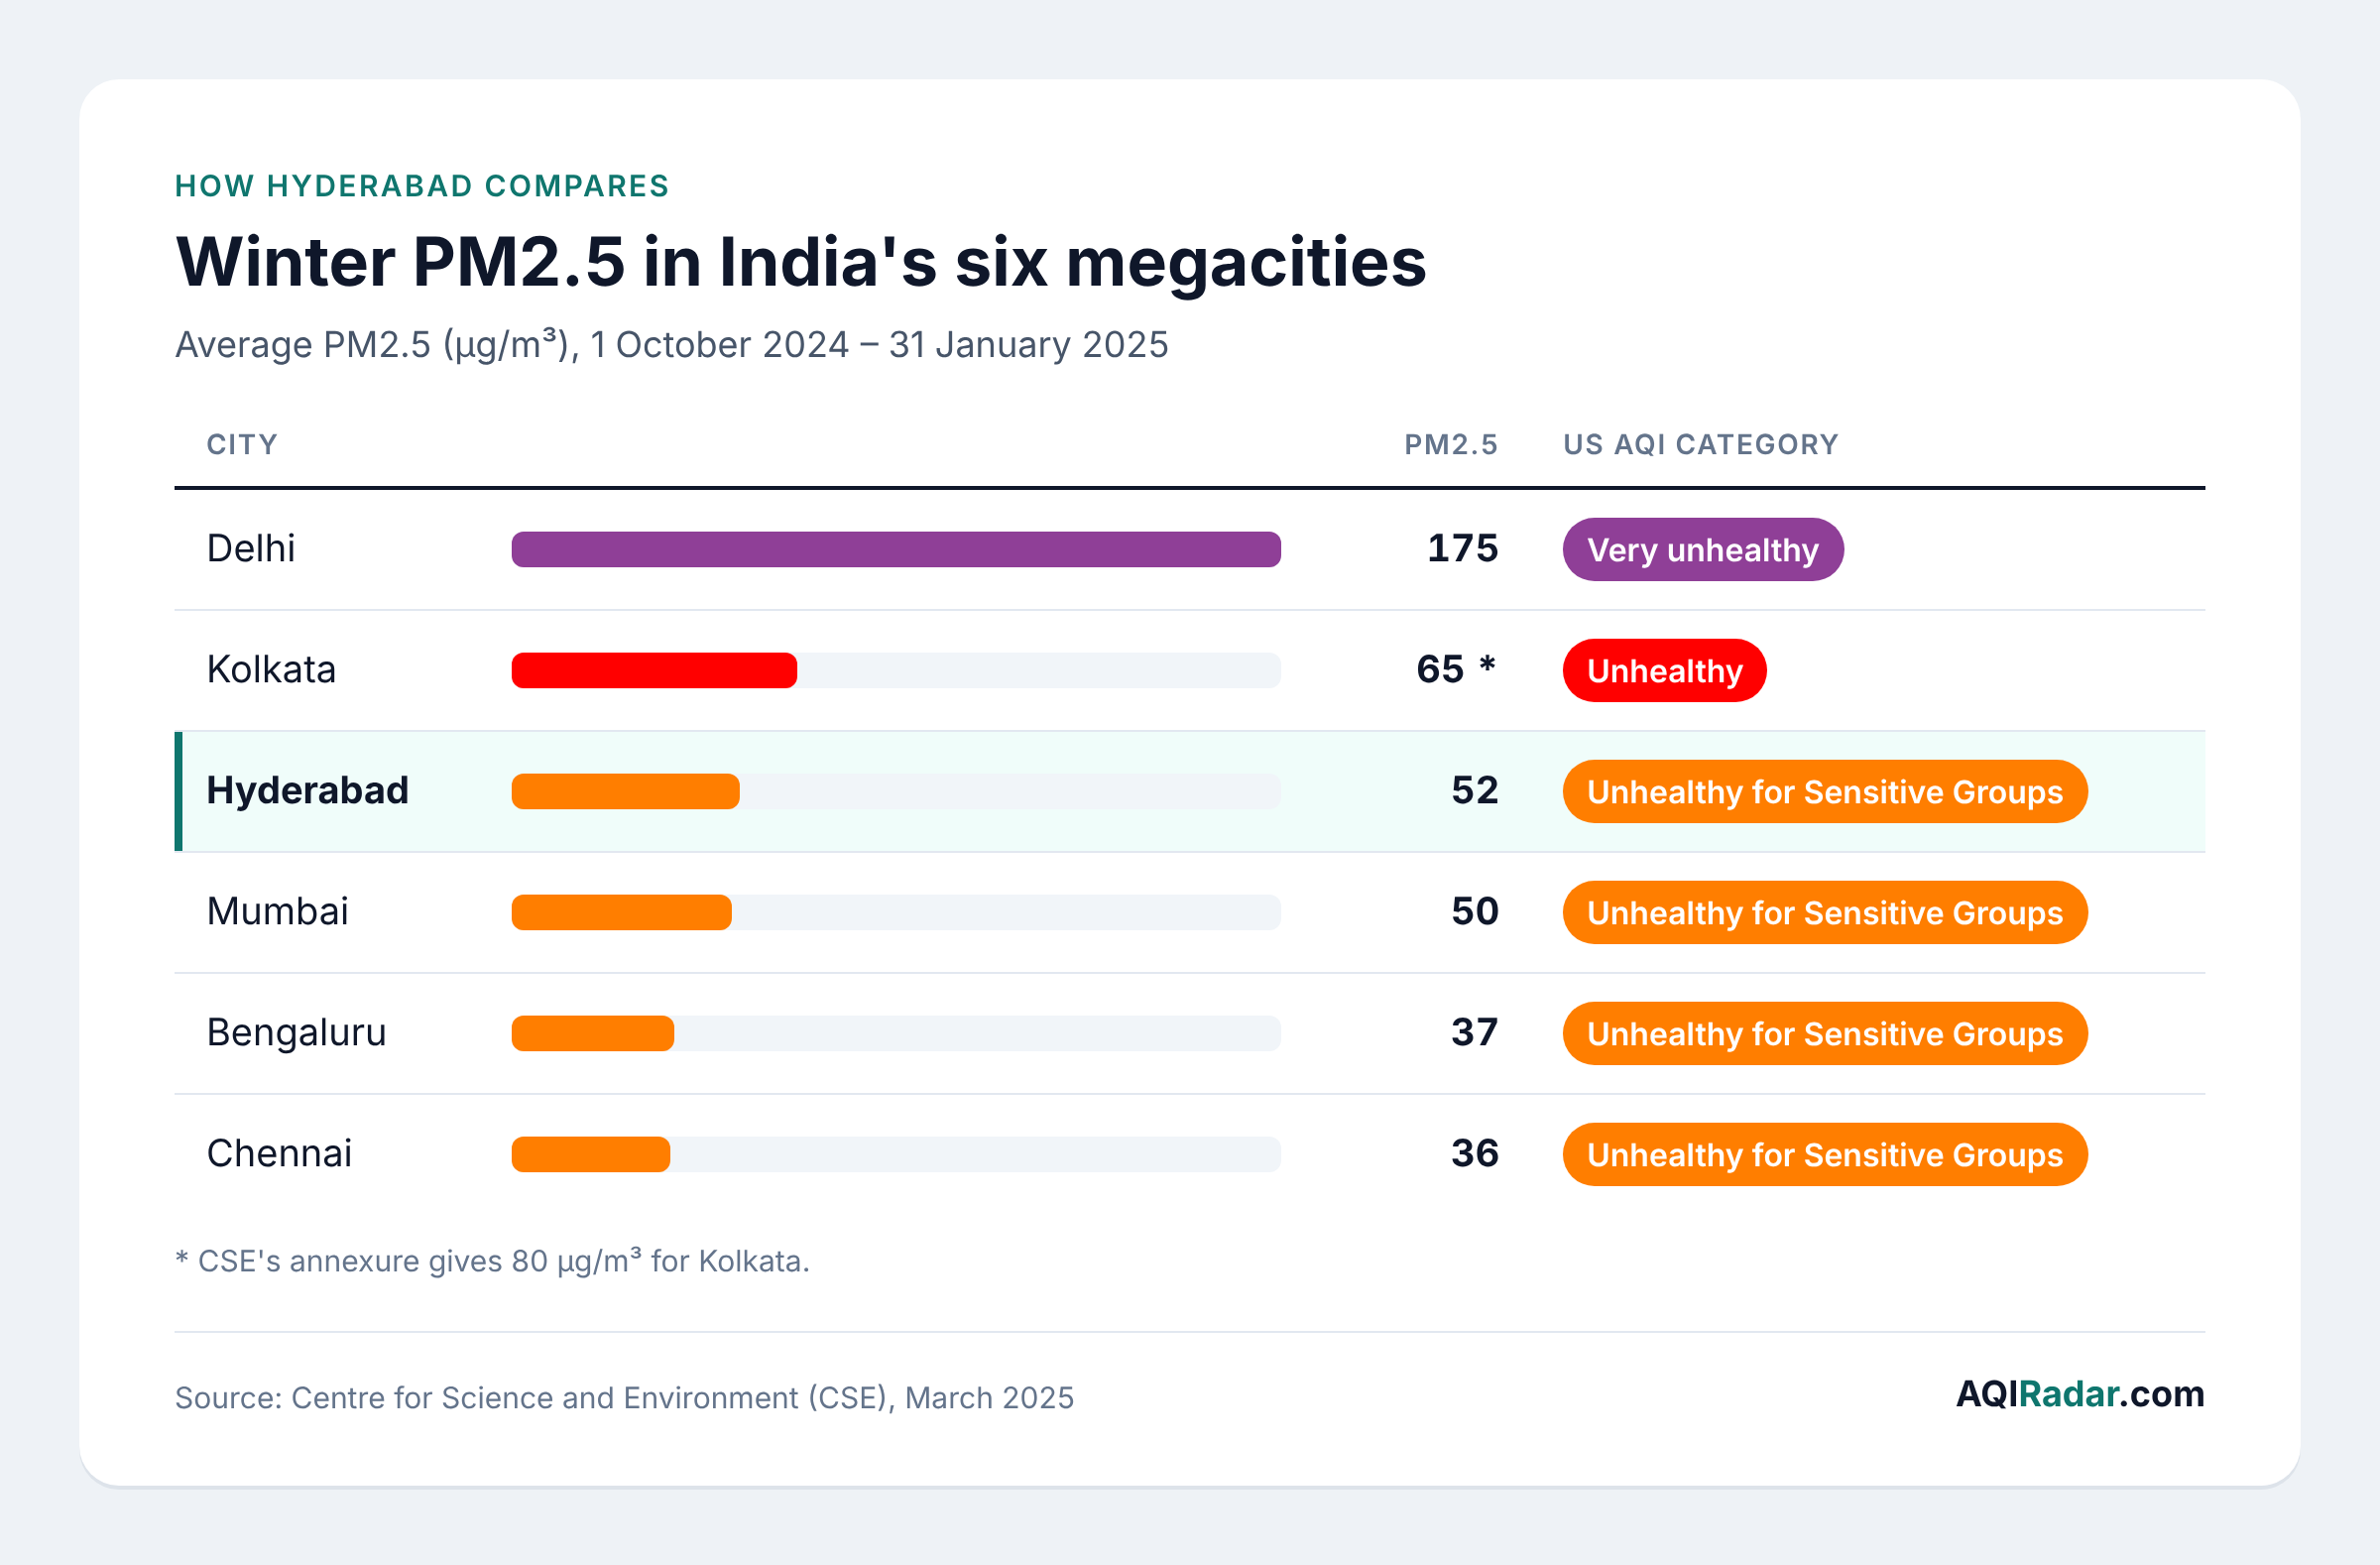
The trend is improving, slowly. Hyderabad's winter average was 16% lower than in 2021–22. Its worst day in winter 2024–25 hit 89 µg/m³ on 25 November 2024, down 51% from the previous winter's peak of 183 µg/m³ (CSE). Annual PM10 fell from 86 to 80 µg/m³ between 2019–20 and 2025–26, according to figures reviewed by the state (UNI).
But it is still far from safe. IQAir data put Hyderabad's 2023 annual PM2.5 at 39.9 µg/m³, just under India's 40 µg/m³ limit but about eight times the WHO guideline (The Hindu).
Forecast for the coming weeks. We are now in early October, when the monsoon has ended and nights start cooling. Based on past winters, expect AQI to drift upward through late October and peak in November and December, especially on calm, clear nights and early mornings. Watch the hourly trend on the Hyderabad live page rather than relying on a single day's reading.
Pollution hotspots in Hyderabad
The industrial north-west, around Pashamylaram, Patancheru and Sanathnagar, is consistently Hyderabad's most polluted zone. CSE's station-by-station winter averages for 2024–25 show a clear split (CSE):
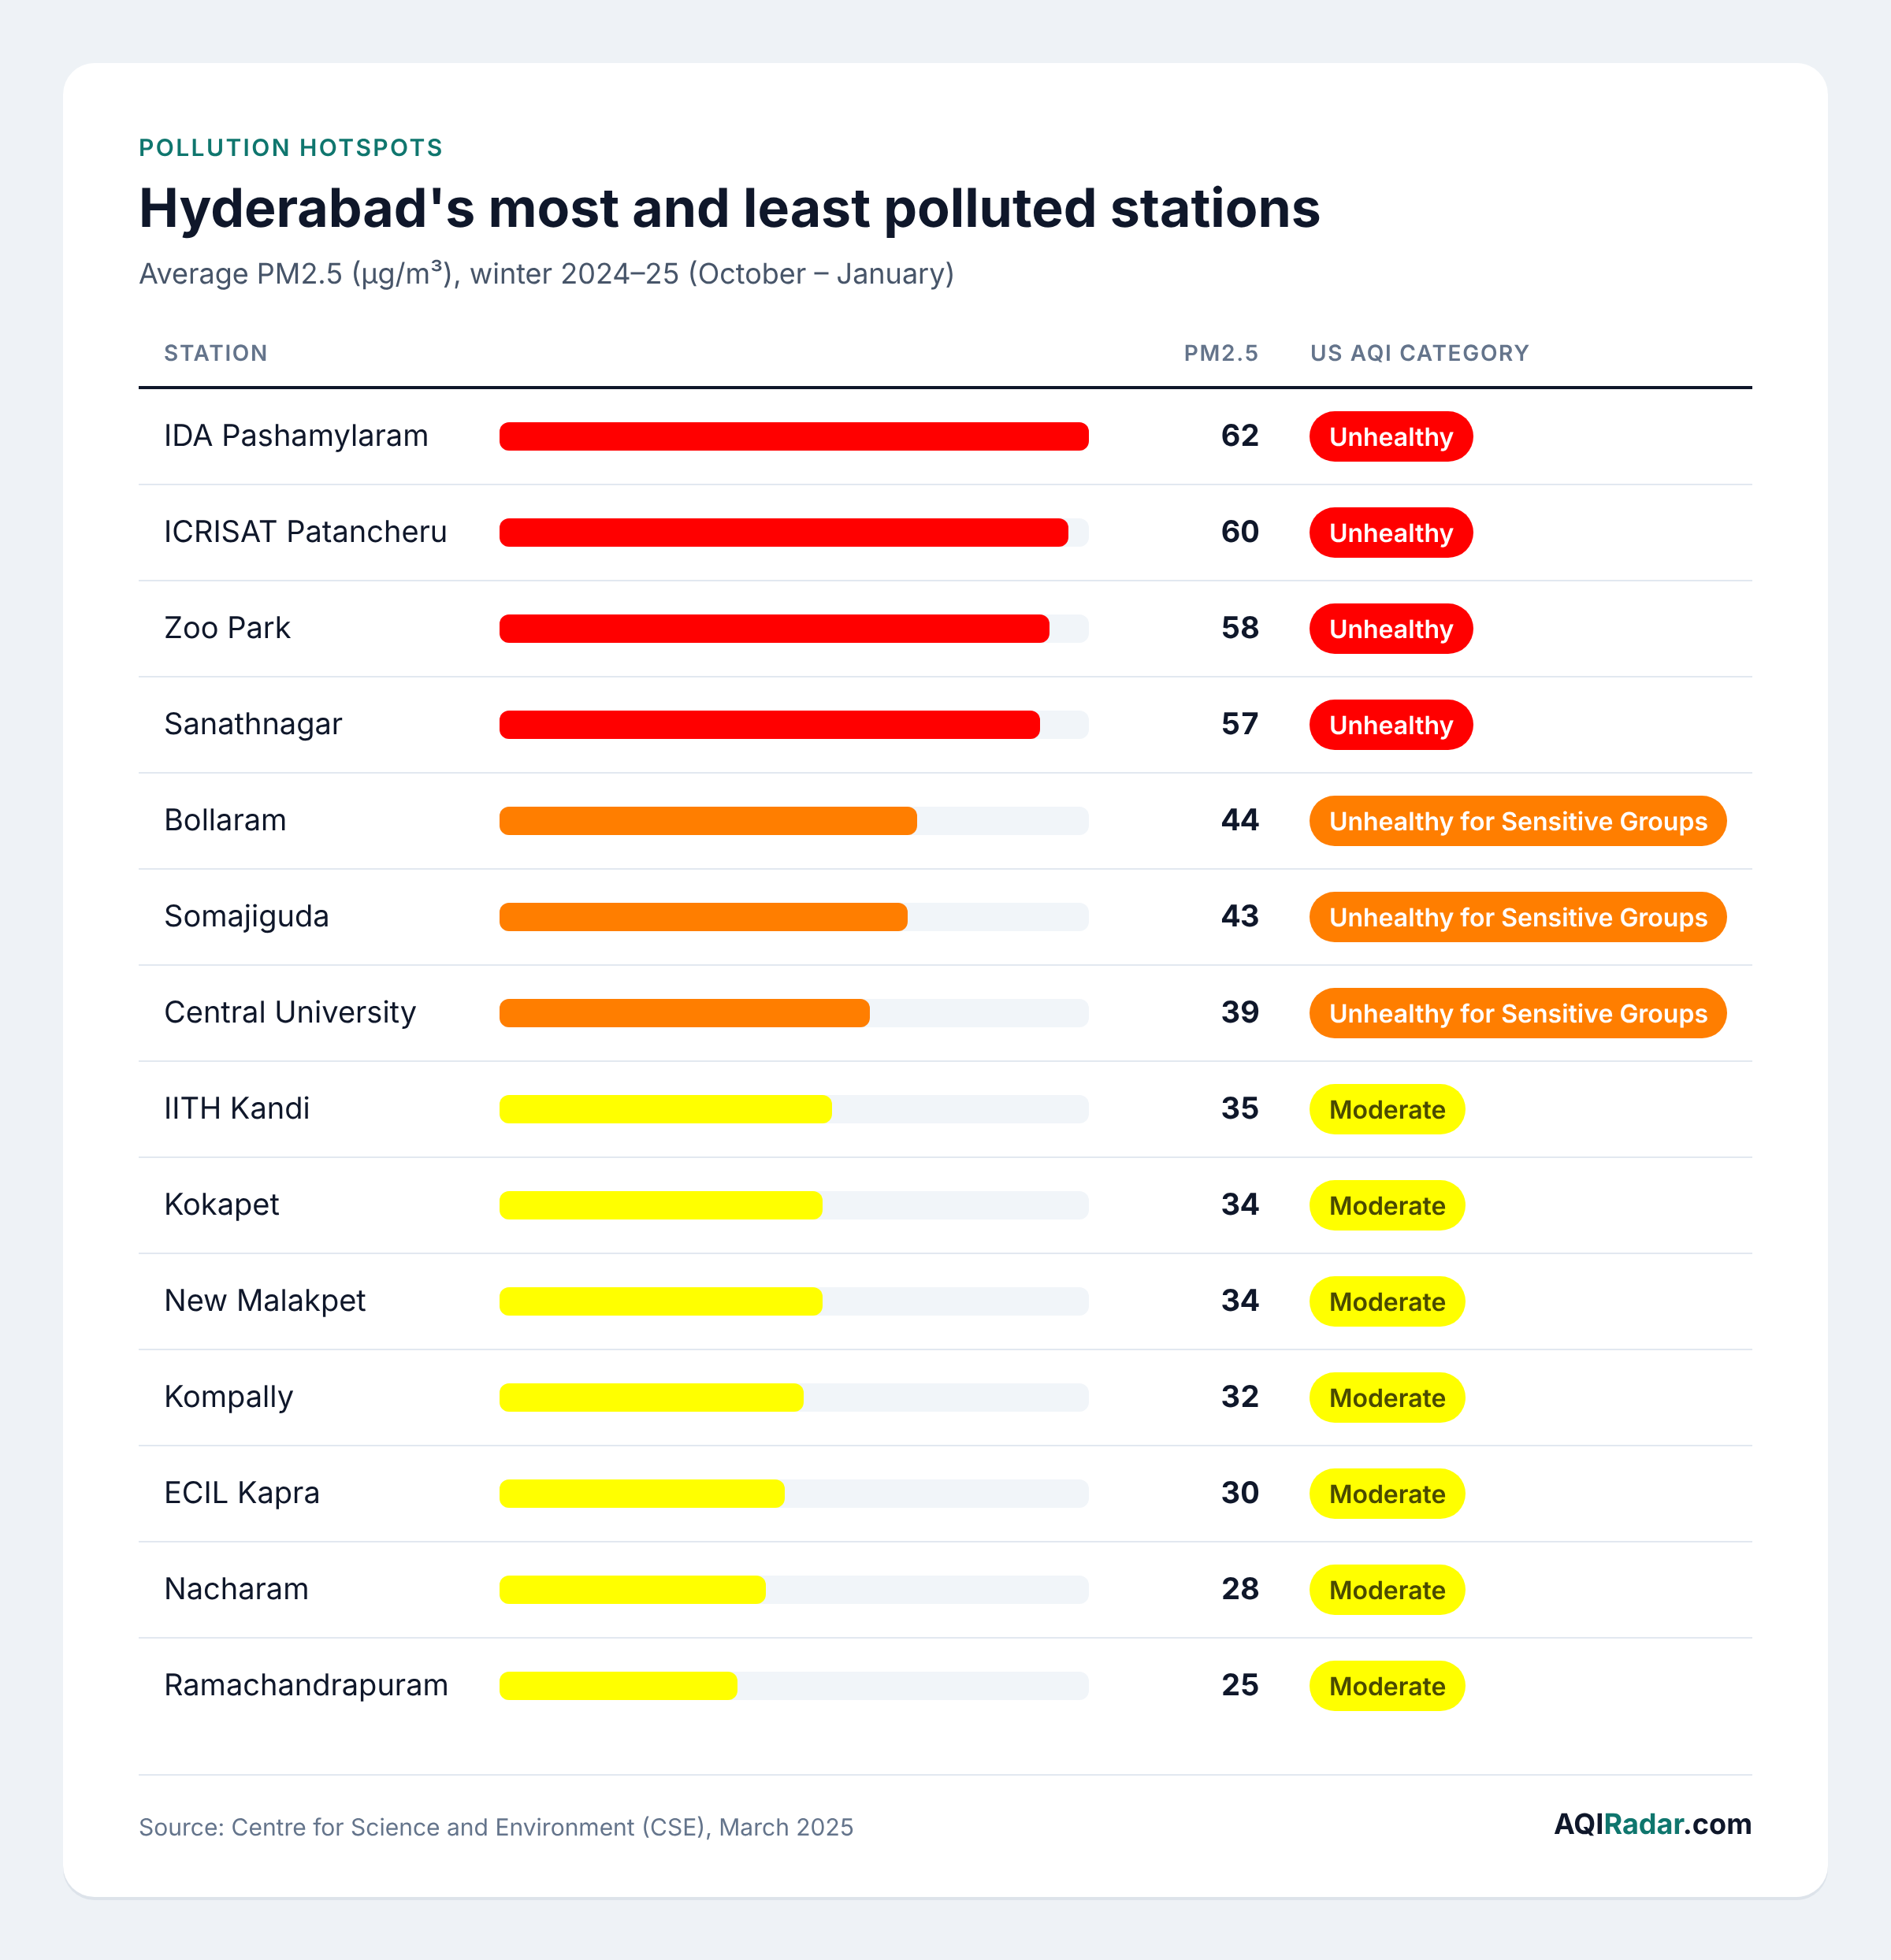
Pashamylaram has also seen the sharpest spikes. It recorded AQI 341 on 23 November 2024, in the "very poor" band on India's scale (Deccan Chronicle). Sanathnagar saw a localised spike to 182 µg/m³ that winter (CSE).
Today's live readings point to a second cluster in the IT corridor. On 10 October 2026, Serilingampalle (172), Financial District (122), Manikonda (121) and Nanakramguda (114) were all above 100, alongside central areas like Koti (126) and Chanchalguda (124) (AQIRadar). If you live or work in these areas, an indoor AQI monitor helps you see what is reaching inside your home or office.
Health effects, who is at risk and how to protect yourself
Even Hyderabad's "moderate" days carry a real health cost, because fine particles reach deep into the lungs and bloodstream. Worldwide, outdoor air pollution caused an estimated 4.2 million premature deaths in 2019. Of those, 68% were from heart disease and stroke, 14% from COPD, 14% from lower respiratory infections and 4% from lung cancer (WHO).
Indian data shows the same. A 2024 Lancet Planetary Health study of ten cities, including Hyderabad, linked 7.2% of daily deaths to PM2.5 above WHO guidelines. Each 10 µg/m³ rise in two-day PM2.5 raised daily deaths by 1.4% (The South First). The heart risk is covered in detail in our guide on AQI and heart health.
Who should be most careful:
Children, whose lungs are still growing
Adults over 60
Pregnant women
People with asthma, COPD or heart disease
Outdoor workers, delivery riders and daily two-wheeler commuters
What to do at each level (US AQI):
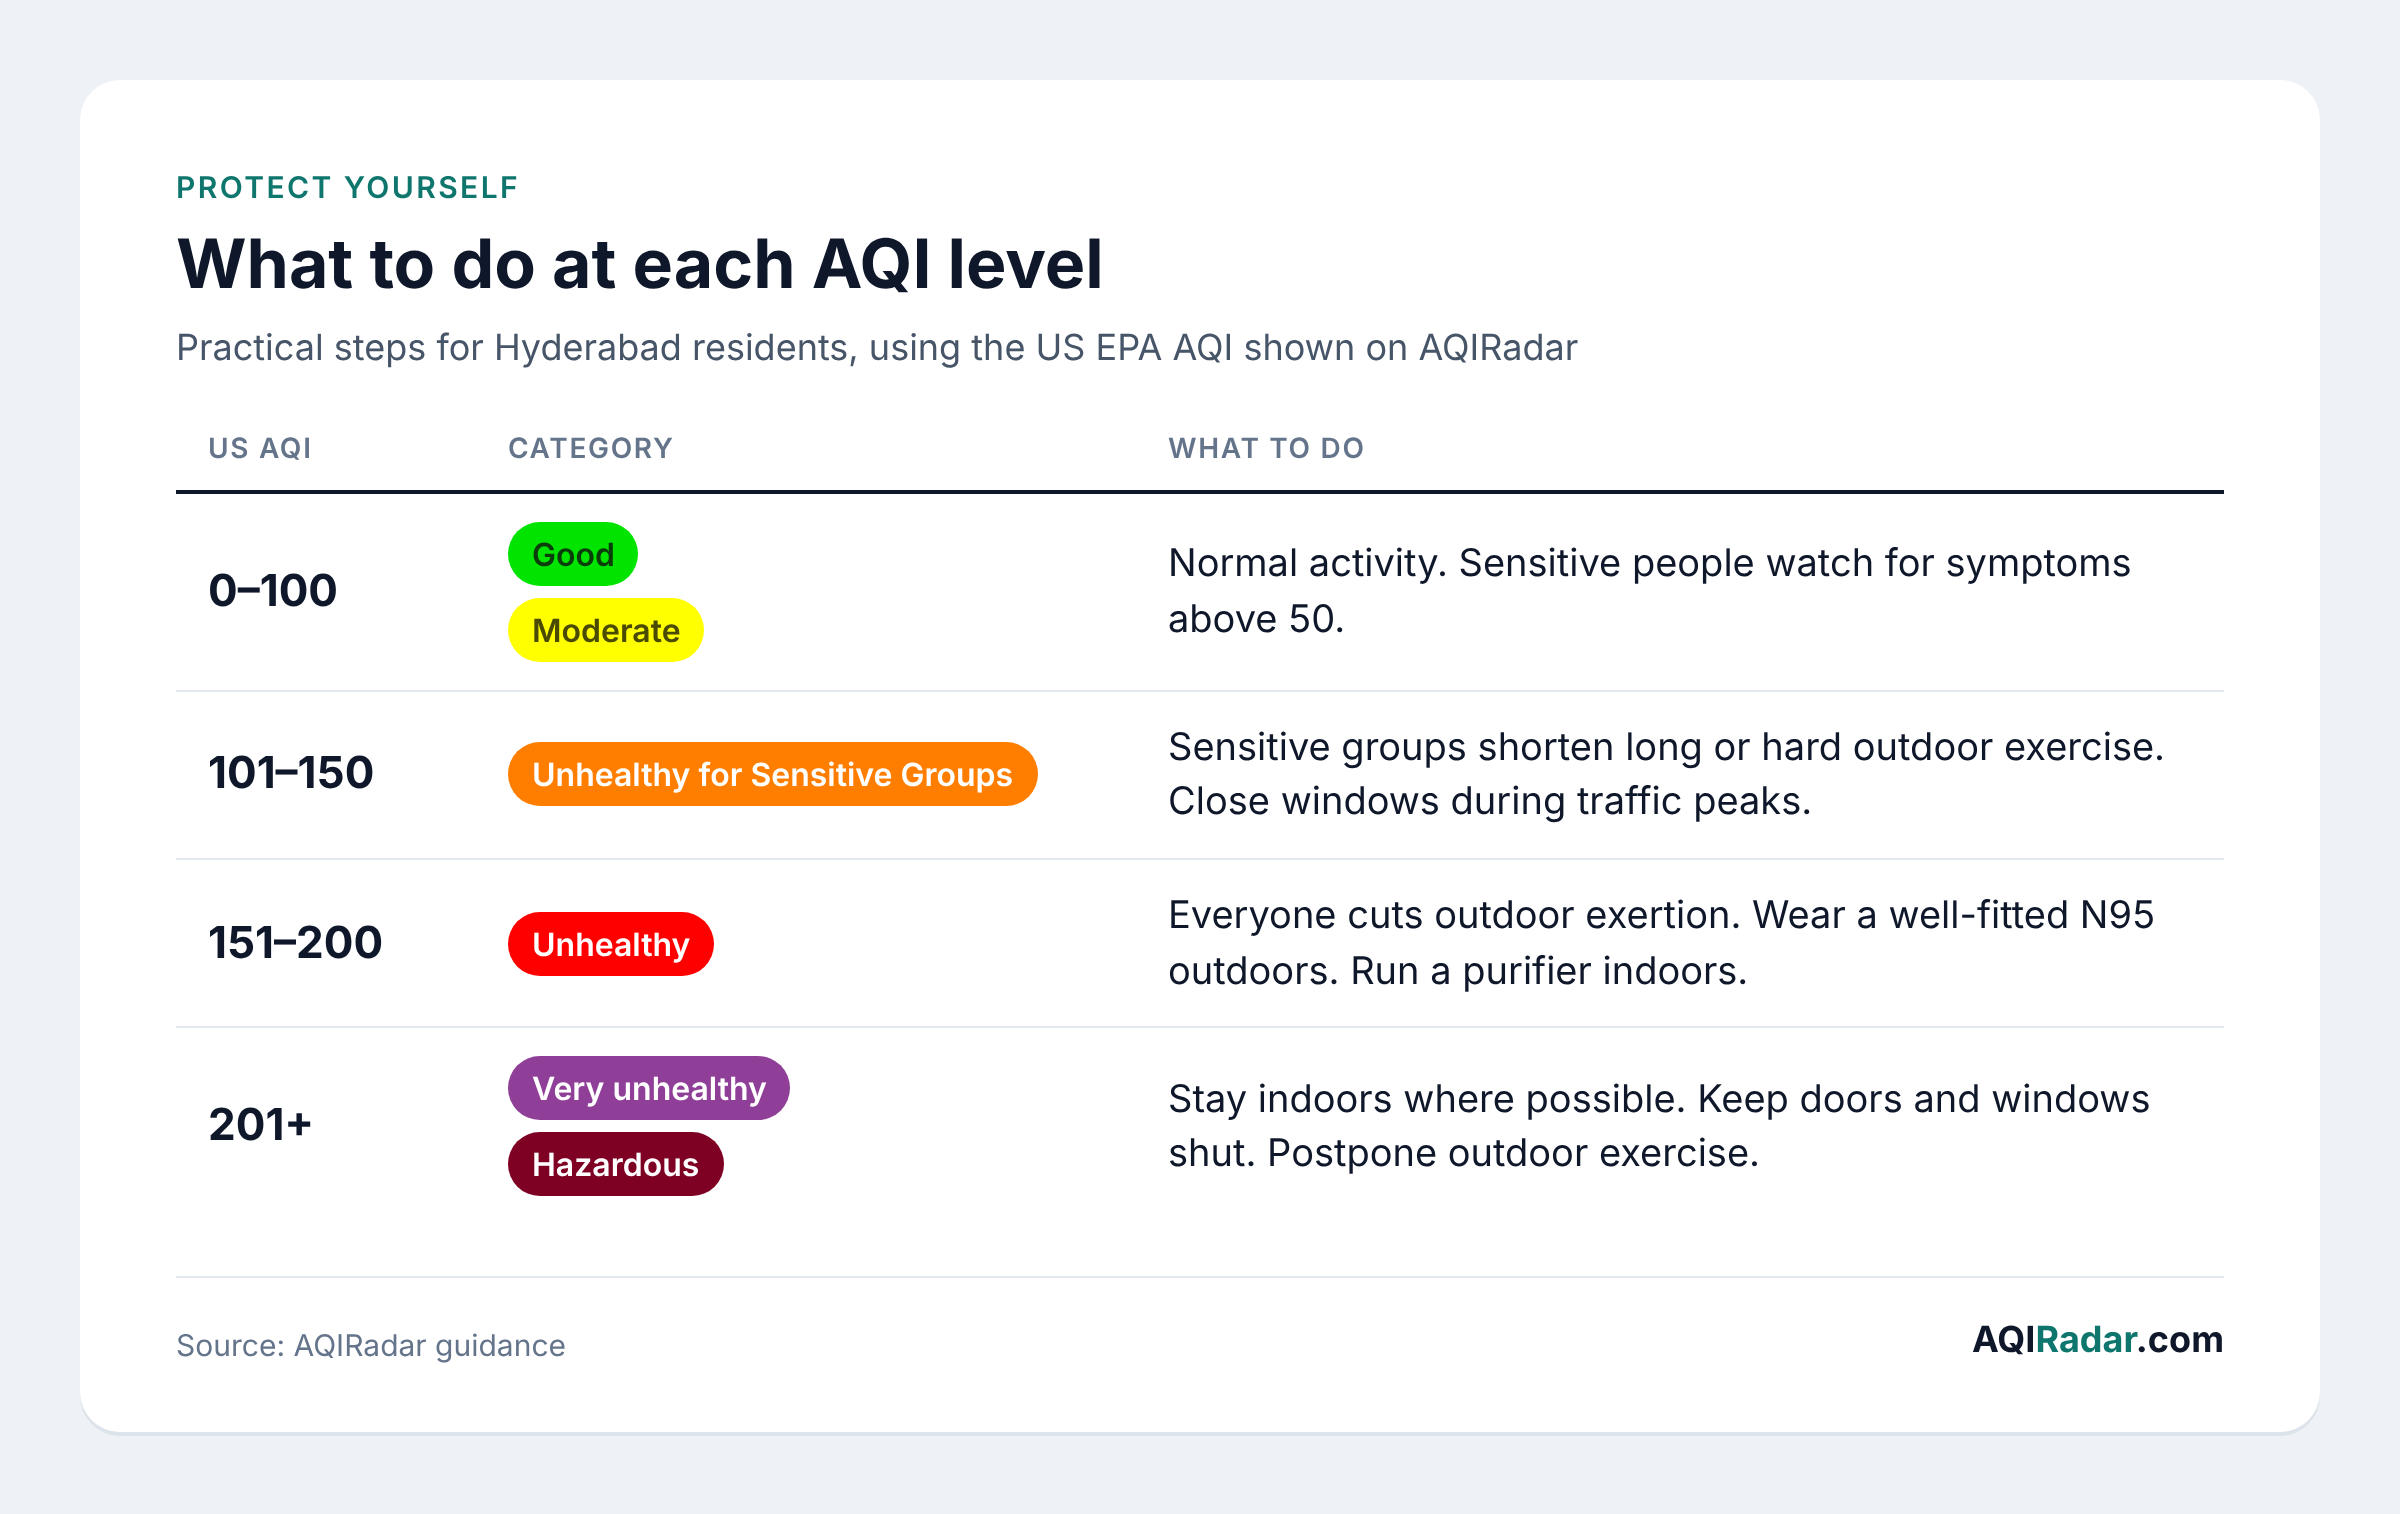
Practical steps for Hyderabad:
Check before you step out. Mornings and late evenings in winter are often the worst. The AQI health checker gives advice for your own risk profile.
Wear the right mask on your commute. Cloth masks do little against PM2.5. Pick a certified N95 that seals well; see our masks for daily commuting.
Clean the air at home. A HEPA purifier sized for the room is the most reliable fix. Our air purifier calculator tells you what capacity you need, and the bedroom air purifier guide covers the room where you spend most hours.
Cut indoor sources. Ventilate while cooking, and go easy on incense and mosquito coils. More ideas in how to reduce PM2.5 inside your home.
Extra care for vulnerable family members. If someone at home has asthma, see our picks for air purifiers for asthma.
Frequently asked questions
What is the AQI in Hyderabad today? On 10 October 2026 at 7:43 pm IST, Hyderabad's average was AQI 114 (Unhealthy for Sensitive Groups) on the US scale across 75 stations. Check the live Hyderabad AQI for the current hour.
Is Hyderabad's air quality better than Delhi's? Yes, by a wide margin. In winter 2024–25, Hyderabad averaged 52 µg/m³ of PM2.5 against Delhi's 175 µg/m³ (CSE). It is still well above the WHO guideline of 5 µg/m³.
Which area of Hyderabad has the worst air? IDA Pashamylaram, near Patancheru, had the highest winter 2024–25 PM2.5 average at 62 µg/m³, followed by ICRISAT (60), Zoo Park (58) and Sanathnagar (57) (CSE).
Which month has the worst air in Hyderabad? November is usually the worst, with high levels continuing into December and January. The monsoon months are the cleanest (CSE; UrbanEmissions.info).
Why does the Sameer app show a different AQI from AQIRadar? Sameer uses India's CPCB scale, while AQIRadar uses the stricter US EPA scale. The same PM2.5 reading of 50 µg/m³ is "Satisfactory" in India but "Unhealthy for Sensitive Groups" in the US system.
Is it safe to go for a morning walk in Hyderabad? Below AQI 100, yes for most people. Above 150, or above 100 if you have asthma or heart disease, move your walk indoors or to a time when the live reading is lower. Our page on whether AQI 150 is good or bad has more detail.
Related reading on AQIRadar
Sources
AQIRadar — Hyderabad, Telangana live air quality, accessed 10 October 2026
Centre for Science and Environment — Winter pollution crisis in megacities of India: Going beyond Delhi – Hyderabad, 18 March 2025
Centre for Science and Environment — Megacities winter pollution note, March 2025
UrbanEmissions.info — Air Quality Analysis for Hyderabad, India, undated (2018 emissions inventory)
UNI — Report on Telangana Air Quality Monitoring Committee review of NCAP measures, 7 October 2026
The Hindu (via PressReader) — City eight times more polluted in 2023 vis-à-vis WHO standards: report, 22 March 2024
Siasat — Winter chill turns air quality unhealthy in Hyderabad, 2 December 2025
Deccan Chronicle — Air quality hazardous in Hyderabad: PCB data, 1 December 2024
US EPA — PM NAAQS Air Quality Index fact sheet, February 2024
Central Pollution Control Board — National Air Quality Index, October 2014
World Health Organization — Ambient (outdoor) air pollution fact sheet, 24 October 2024
Greenpeace India — Updated air quality guidelines by WHO, 22 September 2021
The South First — Over 7% of daily deaths in 10 Indian cities linked to PM2.5 pollution: Lancet study, July 2024